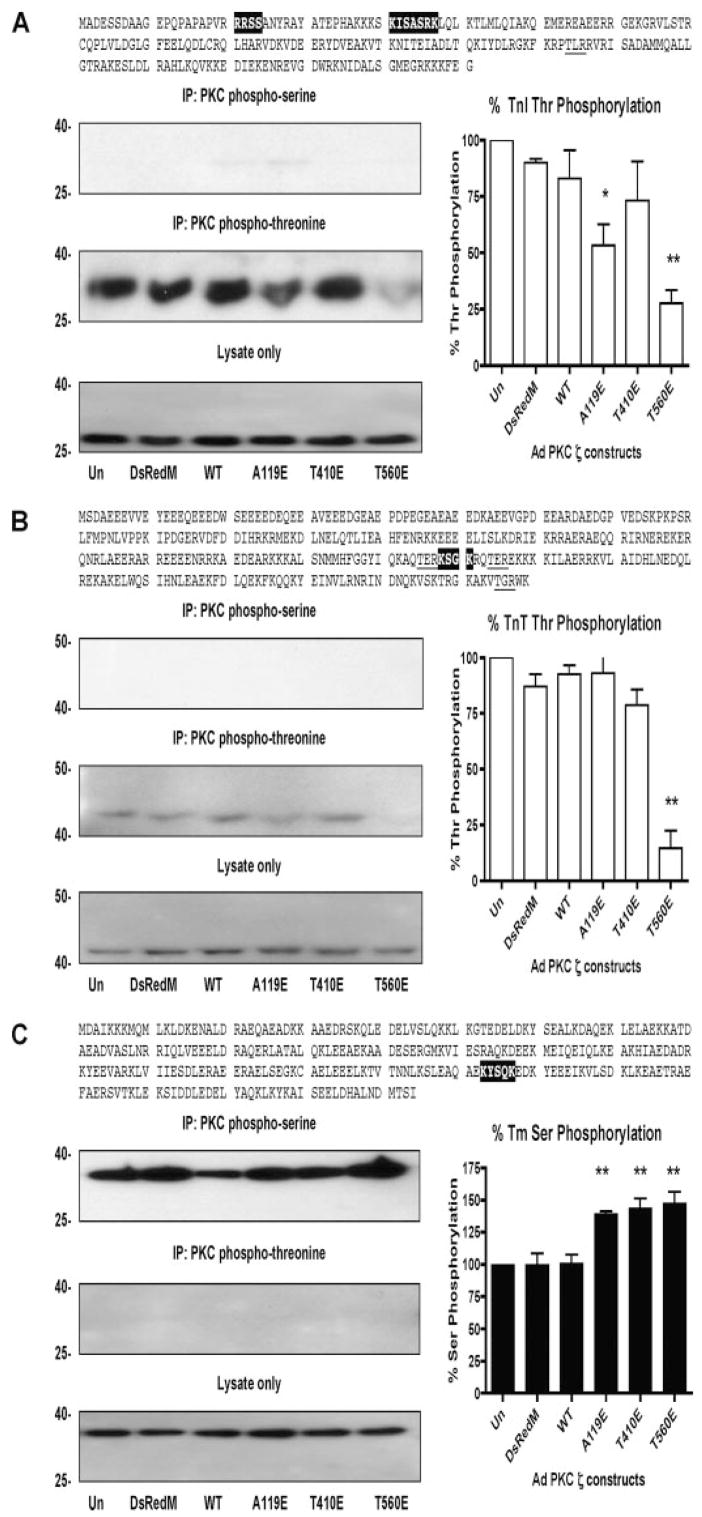
FIGURE 3. Thin filament protein phosphorylation by PKCζ.
A, cTnI:PKC phospho-motifs are highlighted (Ser) and underlined (Thr), representative IP-Westerns of cTnI Ser and Thr phosphorylation (left), quantification of Thr phosphorylation of cTnI (right). B, cTnT:PKC phospho-motifs are highlighted (Ser) and underlined (Thr), representative IP-Westerns of cTnT Ser and Thr phosphorylation (left), quantification of cTnT Thr phosphorylation (right). C, Tm:PKC phospho-motifs are highlighted (Ser) and underlined (Thr), representative IP-Westerns of Tm Ser and Thr phosphorylation (left panels), quantification of Ser phosphorylation (right panel). *, p < 0.05 versus Un, **, p < 0.01 versus Un.

