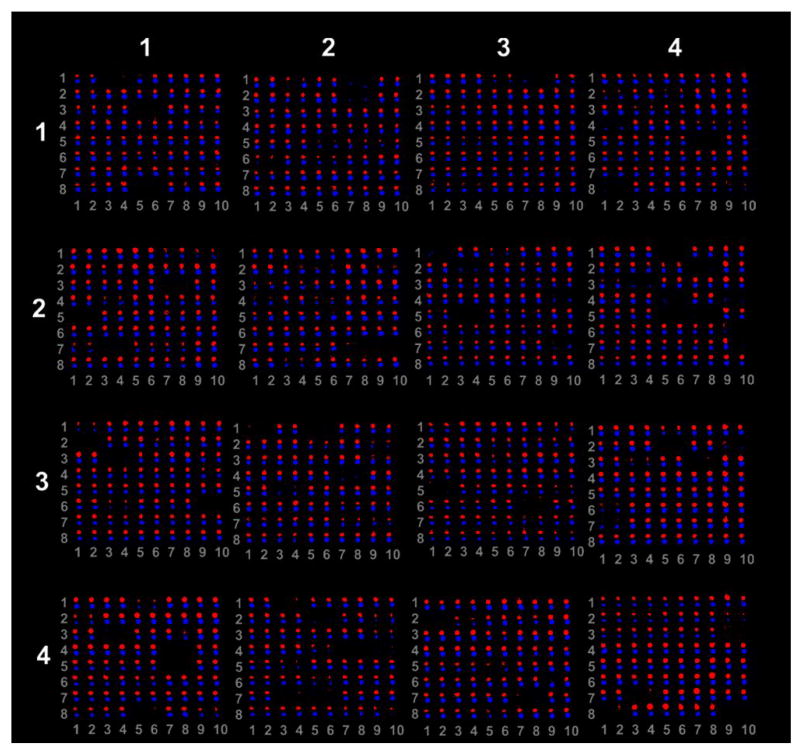
Figure 1.
Microarray analysis of protein expression in dorsal iris (red dots) vs ventral iris (blue dots). The array is divided in 4 meta rows and 4 meta columns. Each meta row is divided to 8 rows and 10 columns. The antibodies are arrayed in duplicates along the columns. In this arrangement column 1 and 2, 3 and 4 and so on contain the same series of antibodies. The intensity of the dot shows the degree of regulation. When the spot is larger between the two samples it indicated up-regulation. Overall, most of the antibodies show interaction with newt proteins and differential regulation between the dorsal and the ventral irises.

