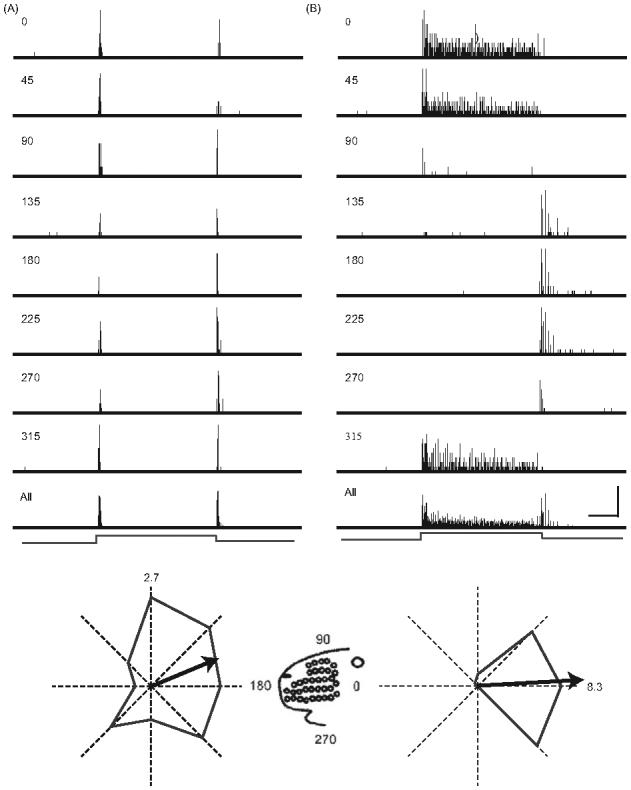
Figure 1.

PSTHs depicting the response of a typical rapidly adapting neuron (A) and slowly adapting neuron (B) to whisker deflections in different directions. PSTHs having 1 ms bins were constructed from responses to ten deflections in each of the eight directions indicated (see figurine for orientation). The bottom-most PSTH is the response accumulated over all stimuli/angles. The duration of each trial was 500 ms with the ramp-and-hold stimulus centered in time (indicated at the bottom). Scale: horizontal = 50 ms; vertical = 8 spikes for the individual angle PSTHs, 35 spikes for the RA All-angle PSTH and 30 for the SA All-angle PSTH. Below each set of PSTHs is a polar plot constructed from responses evoked by stimulus onset; the maximal angle response is indicated in spikes/stimulus. Arrows indicate vector angle and magnitude.
