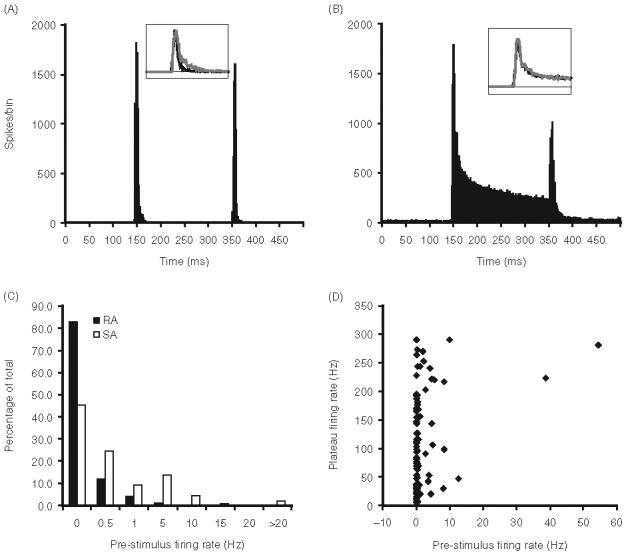
Figure 2.

(A) Population PSTHs constructed from the responses of 98 RA neurons accumulated overall deflection angles. Inset shows population 70 ms long PSTHs constructed from the ON response of RA units in the mouse (black) and rat (gray); PSTHs were scaled to probability of spike per 1 ms bin. Stimulus onsets and offset occur at the 146 and 350 ms bins. (B) Population PSTHs from 110 SAs; conventions as in panel A. (C) Bar graphs illustrating the proportion of trigeminal ganglion neurons that display different levels of spontaneous firing. (D) Scatter plots of the relationship between spontaneous activity and maximum-angle plateau firing rates of SA neurons.
