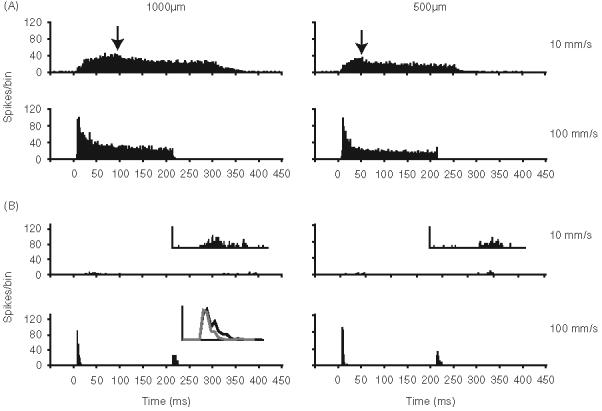
Figure 5.

Amplitude and velocity sensitivity of 23 SA (panel A) and 21 RA (panel B) neurons. Population PSTHs having 1 ms bins depicting responses evoked at two deflection amplitudes and velocities. PSTHs (time 0) are aligned to stimulus onsets; ramp durations are considerably longer for the 1.0mm amplitude, 10 mm/s stimuli. Arrows indicate peak of the PSTHs for 10 mm/s deflections. Insets for the 10 mm/s PSTHs in B show the small RA ON responses at higher resolution. The top panel (12-fold magnification of y-axis). Inset in the left lower panel (1000 mm deflection at 100 mm/s) shows overlaid population PSTHs ON responses to 1000 mm (black) and 500 mm (gray) deflections. For each neuron, the whisker was deflected ten times in its maximally effective direction.
