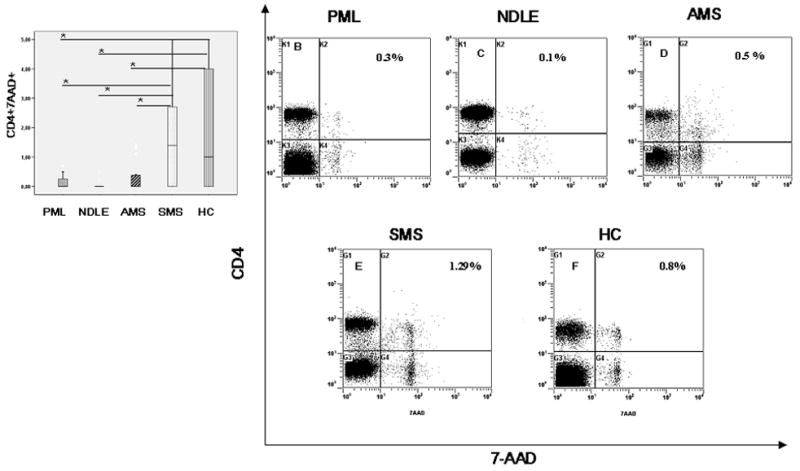
Figure 2.

Median percentages of MBP-stimulated CD4+ T lymphocytes that express 7-AAD (apoptotic lymphocytes) are shown. Data obtained in peripheral blood of patients affected by PML, NDLE, acute (AMS) or stable (SMS) multiple sclerosis and healthy control (HC) are presented. In panel A the boxes stretch indicate from the 25th to the 75th percentile; the lines across the boxes indicate the median values; the lines stretching from the boxes indicate interquartile ranges. Statistical significance is shown:*indicates p<0.05; **indicates p<0.01. Representative results obtained in a PML (Panel B), a NDLE (panel C), an AMS (Panel D) SMS (panels E) patients and a HC (panels F) are shown. The percentage of apoptotic cells appears in the upper right corner.
