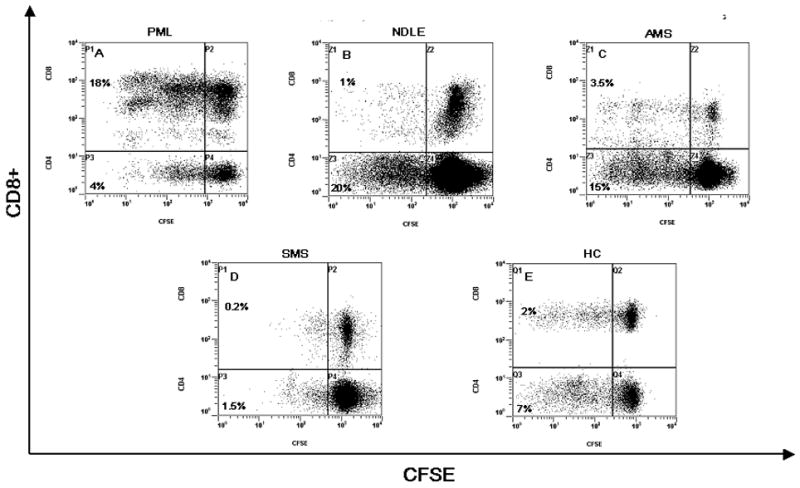
Figure 4.

MBP peptide pool-stimulated proliferation (CFSE –staining). Representative results obtained in a PML (Panel A), a NDLE (panel B), an AMS (panel C), a SMS (panels D) patients and a HC (panels E) are shown. These data represent gated CD3+ T cells that are further gated for CD4+/CD8− or CD4−/CD8+ T cells. CFSE staining is shown on x-axis and CD8 staining on the y-axis. The CD8− populations in the dot plots represent gated CD4+ T cells. The numbers next to the populations represent the proliferating fraction of CD4+ T cells and CD8+ T cells. Non-divided CFSEhigh labeled cells are shown in the upper(CD8+) and lower(CD4+) right quadrants, whereas daughter cell populations (CFSElow) are shown in upper (CD8+) and lower (CD4+) left quadrants because have subsequently lost half of their CFSE signal with each division round.
