
Figure 1.
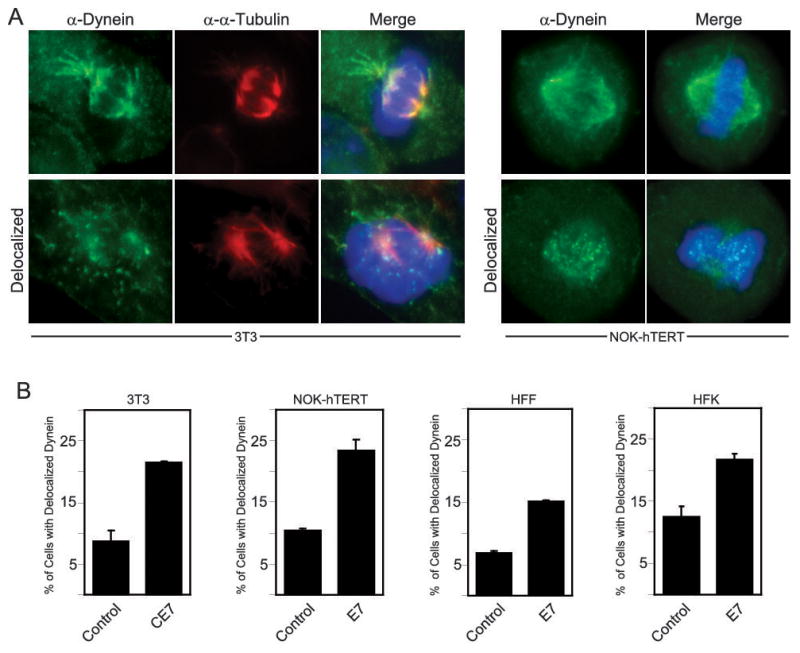
Dynein is delocalized from mitotic spindles in HPV16 E7-expressing cells. (A) Immunofluorescent staining of dynein (green) and α-tubulin (red). An example of normal dynein staining, on mitotic spindles, and abnormal dynein staining, punctate and away from spindles, is shown for both NIH 3T3 cells and NOK-hTERT cells. For each cell type, the example of normal dynein localization is an image of a control cell while the abnormal example is an image of an HPV16 E7-expressing cell. Normal and abnormal dynein localization was seen in both cell populations. (B) Bar graphs showing the percentage of mitotic cells with abnormal dynein localization in either NIH 3T3 cells stably expressing empty vector (control) or C-terminally HA/FLAG tagged HPV16 E7 (CE7) or NOK-hTERT cells, human foreskin fibroblasts (HFFs), or human foreskin keratinocytes (HFKs) stably expressing empty vector or HPV16 E7, as indicated. For the NIH 3T3 cells, the results represent averages from 2 independent experiments where >100 mitotic cells were counted per experiment. For the NOK-hTERT cells, the results represent averages from 3 independent experiments where 100–225 mitotic cells were counted per experiment. For HFF cells, the results represent averages from 2 independent experiments where >110 mitotic cells were counted per experiment. For HFK cells, the results represent averages from 3 independent experiments where >100 mitotic cells were counted per experiment. Error bars indicate the standard error between experiments.