
Figure 1.
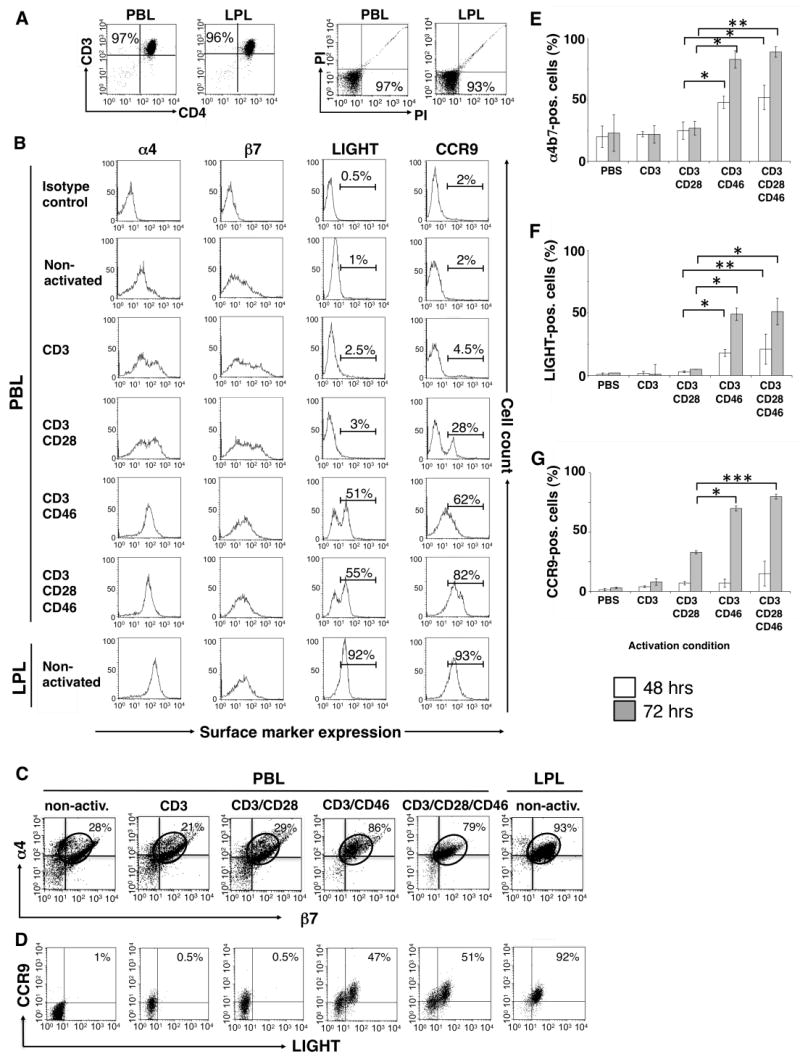
CD3/CD46-activated T cells express α4β7, LIGHT and CCR9. Purified peripheral blood CD4+ T cells (PBL) were activated with the indicated immobilized mAbs and cell samples were analyzed after 48 and 72 hrs via FACS for the expression of α4β7, LIGHT and CCR9. For the expression analysis of CCR9, cells were incubated in media containing 10 nM all-trans-retinoic acid. Freshly isolated non-activated lamina propria lymphocytes (LPL) were used as positive control in all experiments. (A) One representative FACS analysis depicting the purity and viability of the isolated PBL and LPL CD4+ subpopulations. (B) Single stain analysis of α4, β7, LIGHT and CCR9 expression at 72 hrs post activation and double stain analysis for (C) α4 and β7 or (D) LIGHT and CCR9 expression of PBL and LPL 72 hrs post activation/isolation. Shown is one representative FACS analysis of three similarly performed experiments for each double staining. (E to G) Statistical analysis of three similarly performed experiments. Data shown represent integrin/LIGHT/CCR9 expression (mean ± SD) of three separate experiments. Statistical difference in α4β7, LIGHT and CCR9 expression between analyzed lymphocyte subpopulations was determined using the paired Student's t test.