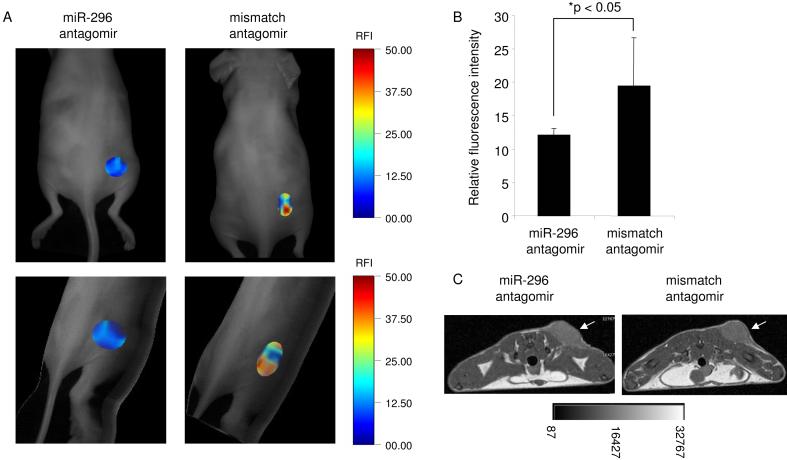
Fig. 7.
In vivo analysis of miR-296 inhibition on tumor neo-vascularization (A) Mice with subcutaneous U87 tumors (N = 6) were injected intravenously with miR-296 antagomirs or mismatch control antagomirs and 4 days later, the same mice were injected with Angiosense 750 and tumor vasculature was analyzed with FMT. Planar (top) and 3-D FMT images (bottom) are displaced in which the fluorescence signals are superimposed with the grayscale planar excitation light image of the mouse. (B) Quantitation of the mean fluorescence intensity measurements from tumors in (A) using OsiriX. Error bars indicate S.D., *p < 0.05, t test. (C) Transverse T1-weighted MR images (4.7T) acquired to show the tumor volume in (A), the white arrows indicate tumor mass

