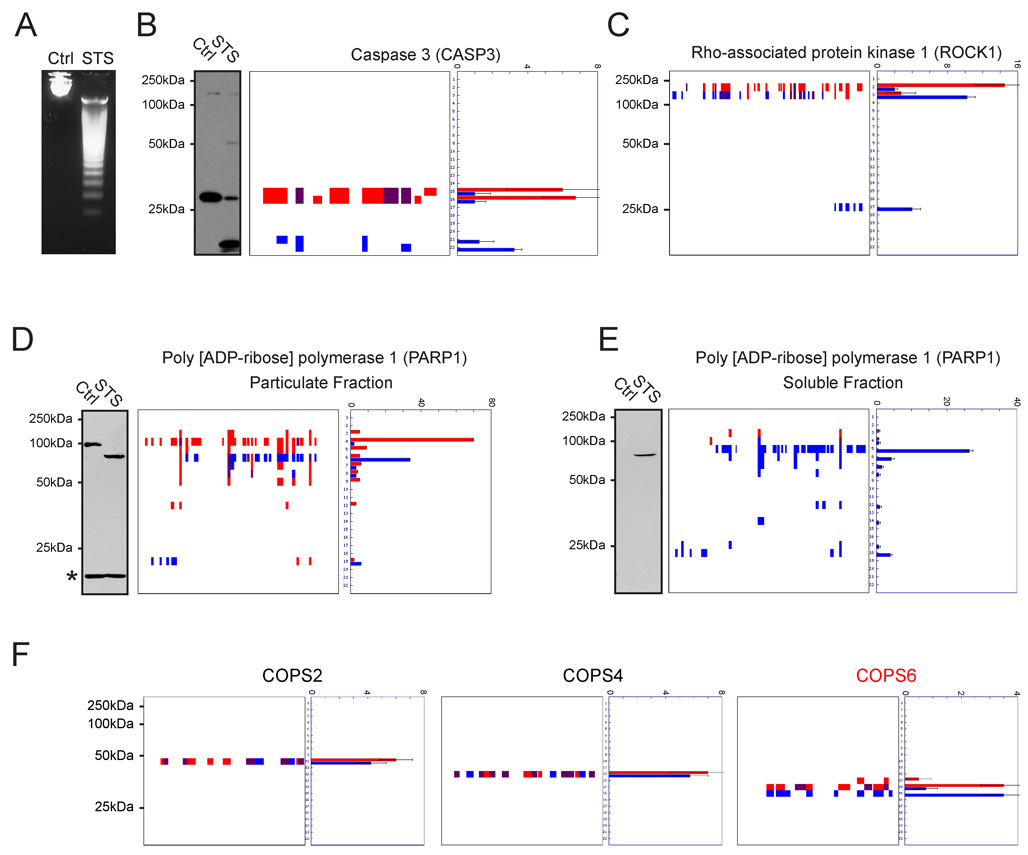
Figure 2. Established markers of apoptotic proteolytic pathways visualized by PROTOMAP.
Apoptosis was induced in Jurkat T-cells by treatment with staurosporine (STS) for 4 hrs, which produced DNA fragmentation (A) and caspase-3 cleavage (B). Cleavage of caspase-3 is evident from the peptograph (B, right panels), which identified peptides for the 32 kDa pro-form of this protease in control cells (red signals, bands 15 and 16), and peptides for the 12 and 17 kDa activated forms in STS-treated cells (blue signals, bands 21 and 22). Peptides detected in both samples are shown in purple. (C) Cleavage of ROCK1 (parent species, 158 kDa) to 130 and 28 kDa fragments. (D) and (E) Cleavage of PARP1 in STS-treated cells. Parental PARP1 was found in the particulate fraction of control cells (D) and, upon induction of apoptosis, was detected in the soluble fraction as a series of cleaved fragments (E). The asterisk in the PARP1 western blot of the particular fraction likely corresponds to antibody cross-reactivity with a background protein, since no spectral counts for PARP1 were detected in the corresponding gel band. Notably, a number of fragments of PARP1 that are not observed by immunoblotting were evident from the peptographs. This likely reflects the restricted epitopes recognized by anti-PARP1 antibodies. (F) Peptographs for representative members of the COPS family, showing selective cleavage of COPS6 in apoptotic cells, as previously demonstrated (Correia et al., 2007). Peptographs for all nine members of the COPS family can be found in Supplemental Figure 2. Spectral count data are represented as the mean +/− SEM for four independent experiments.

