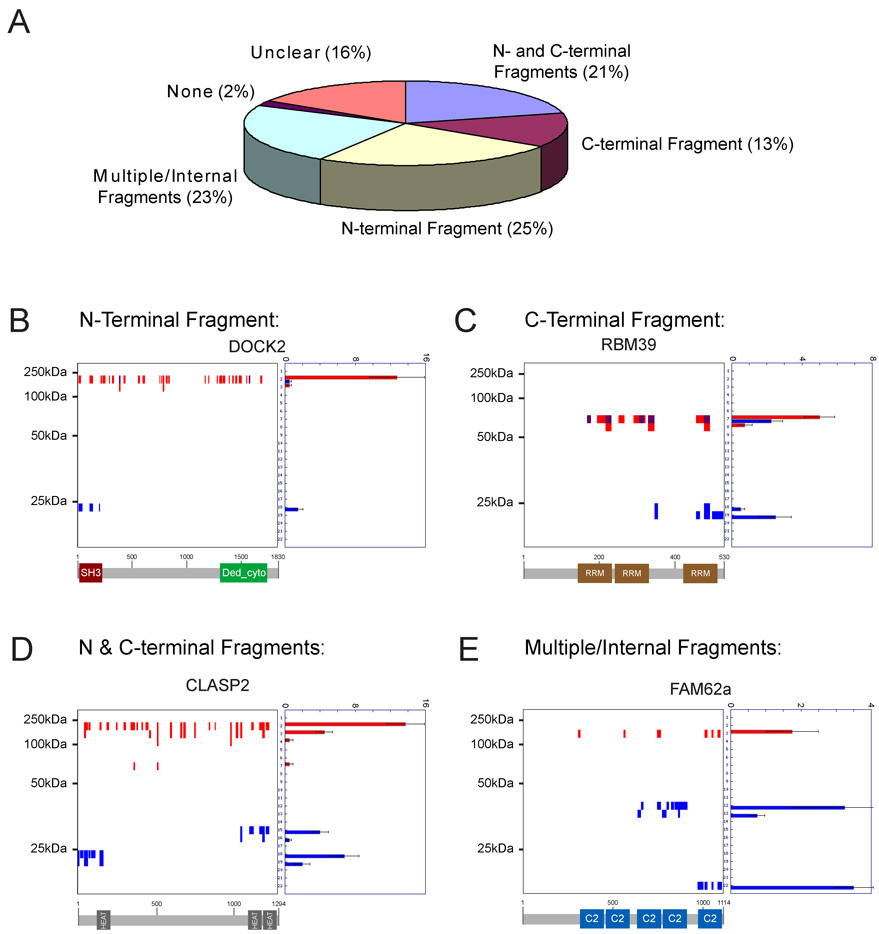
Figure 5. Visualization of the topography of protein cleavage events in apoptotic cells.
(A) The vast majority (> 95%) of cleaved proteins generated at least one persistent fragment in apoptotic cells. Essentially all possible topographical classes of fragments were observed: 1) N-terminal (25%) 2) C-terminal (13%), 3) N- & C-terminal (21%), and 4) internal (23%). “Unclear” refers to cleaved proteins with fragments that could not be obviously assigned to one of the other four fragment classes. (B)–(E) Peptographs for representative examples of N-terminal (B), C-terminal (C), N- and C- terminal (D), and multiple/internal (E) fragments. Predicted domain structures for each protein are shown below each peptograph to highlight the fact that most persistent fragments map to functional protein domains. Spectral count data are represented as the mean +/− SEM for four independent experiments.

