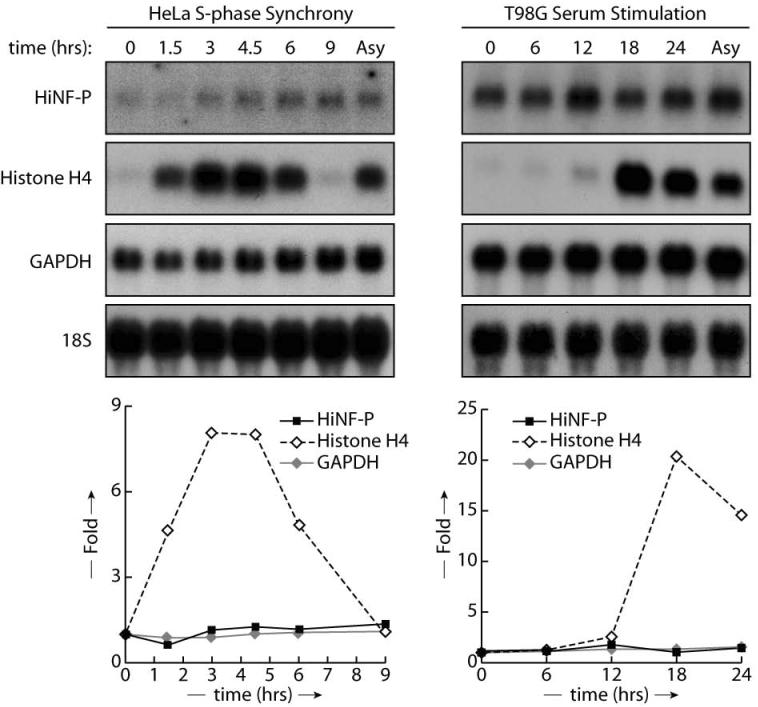
Figure 1. HiNF-P mRNA levels during the cell cycle and cell proliferation.
HiNF-P mRNA levels were analyzed in either HeLa cells synchronized by the double thymidine block method (left panel) or in T98G released from quiescence by serum stimulation (right panel). Total RNA was isolated from samples taken at the indicated time points after release and analyzed by northern blot using specific probes shown on the left. Lower panels' shows band quantification by PhosphoImager and are expressed as fold change compared to 18S RNA (Asy: asynchronous).

