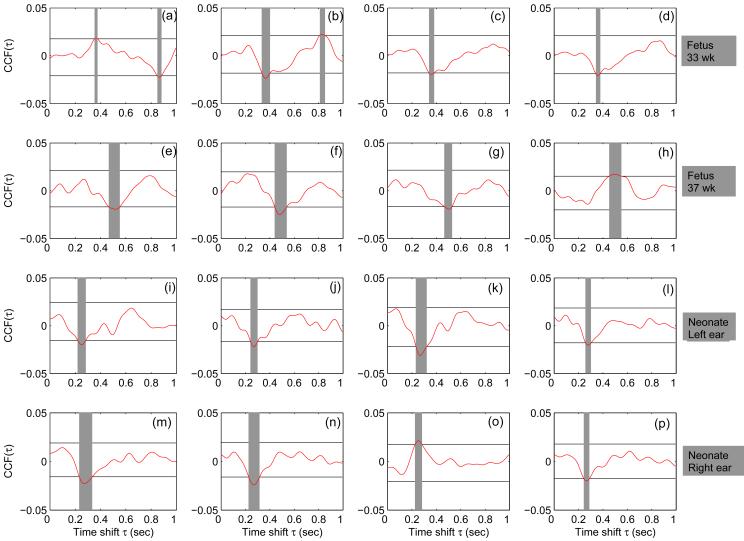
Figure 2.
ER from four different MEG sensors quantified using CCF for subject pat416 in (a-d) 33 weeks (e-h) 35 weeks of gestation. ER of the neonate are shown in (i-l) for left ear stimulation and (m-p) for right ear stimulation. The horizontal lines represent the bootstrap confidence limit. The time points at which CCF exceeds the confidence limit are highlighted in grey color.

