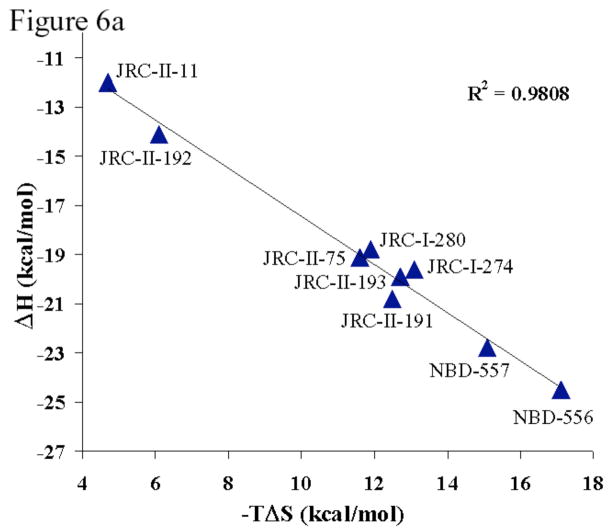
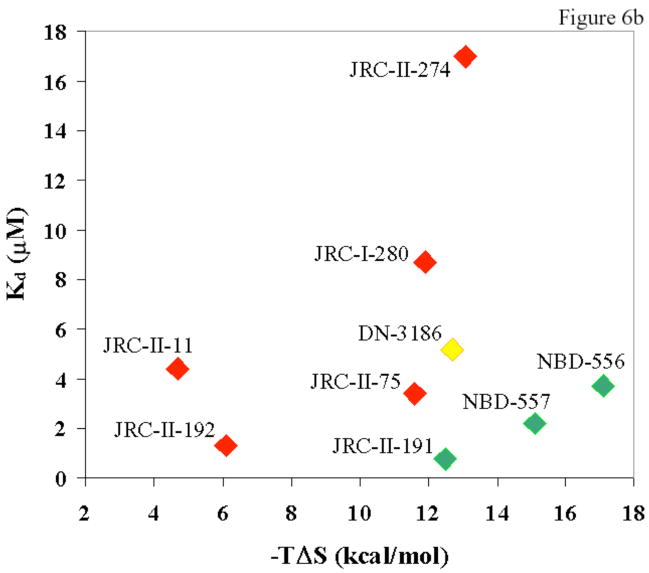
Figure 6. Thermodynamic parameters associated with the binding of NBD-556 analogues to HIV-1 gp120.
a. The relationship between the entropy change (−TΔS) and enthalpy change (ΔH) associated with the binding of NBD-556 analogues to HIV-1YU2 gp120 is shown. The least-squares regression line is depicted, along with the R2 value. b. The relationship is shown between the ability of an NBD-556 analogue to enhance HIV-1 infection of CCR5+ cells and the dissociation constant (Kd) and entropy change (−TΔS) associated with compound-gp120 binding. The symbols associated with the compounds are colored according to the ability of the compound to promote HIV-1 infection of CD4−CCR5+ cells. The color code is the same as that used in Tables 1 and 2, from red (none/low) to green (high level of enhancement).


