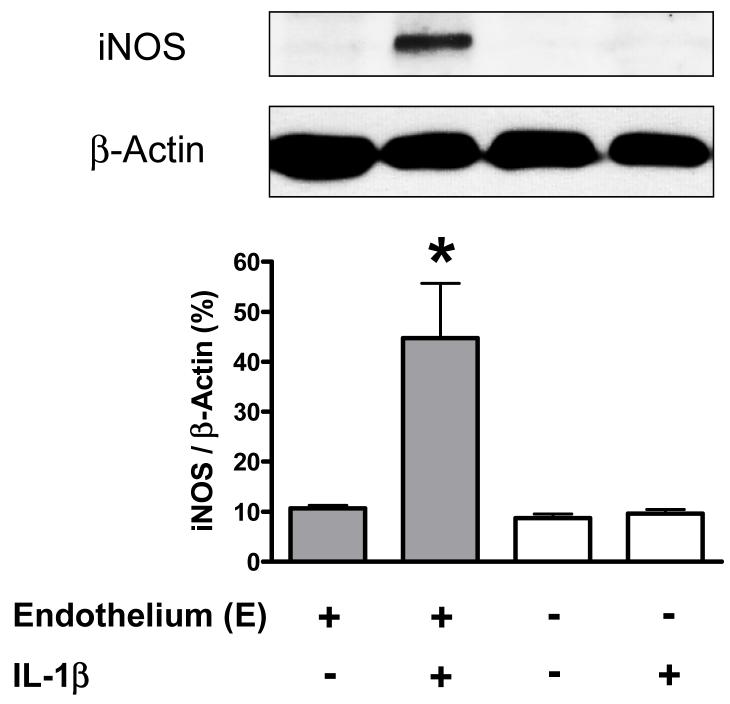
Figure 7. IL-1β induces iNOS protein expression in endothelium-intact vessels.
The figure depicts a typical western blot image of iNOS protein expression (upper figure) and the statistical analysis of changes of iNOS protein expression in mouse endothelium-intact and -denuded aortic rings, which were incubated with DMEM [Control; E(+), n=3; E(-), n=3], IL-1β [20 ng/ml; E(+), n=3; E(-), n=3]. Data are expressed as mean±SEM of n animals. *P<0.01, IL-1β vs. Control in endothelium-intact vessels.

