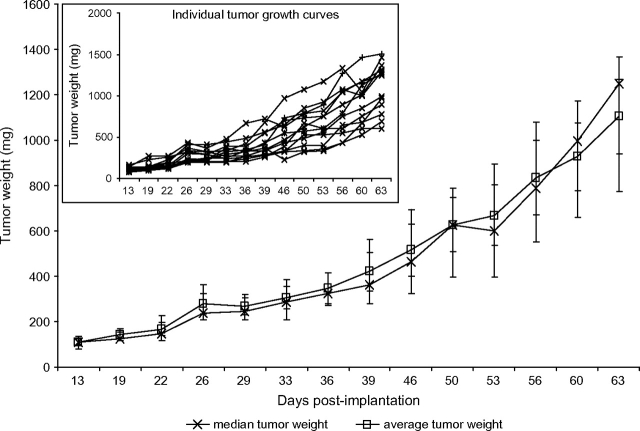
Figure 5.
Tumor weight plots for MDA-MB-361 human breast tumors implanted in the mammary fat pads of athymic nude (nu/nu Ncr; Animal Production Program, NCI-Frederick) mice. The data are from Table 2. The main graph presents the median and average tumor weights for a group of 13 mice, each implanted with 1 × 10⁷ cells in 0.1 mL. The inset presents the individual growth curves for each of the 13 mice. Individual tumor weights were calculated as weight in mg = (length × width2)/2. The error bars are the 95% confidence interval of the average or the median, as appropriate.

