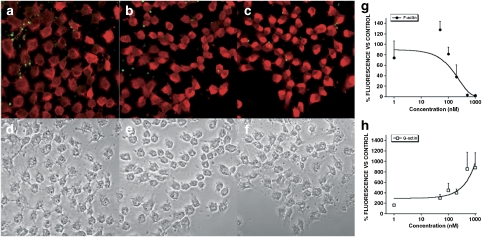
Figure 2.
Effects of high concentrations of PTX-2 on the actin cytoskeleton in Clone 9 cells. Confocal imaging of F- and G-actin double-staining of Clone 9 rat hepatocytes showing fluorescence (upper row) and transmission (lower row) images. F- and G-actin were labelled with Oregon Green 514 phalloidin and Texas Red DNase I, respectively. Clone 9 cells incubated with 200 nM PTX-2 (a and d) 500 nM PTX-2 (b and e) and 1000 nM PTX-2 (c and f). Images are representative of three independent experiments. Digital zoom= × 2. Scale bar=50 μm. (g and h) represent dose–response curves of the effect on F- and G-actin of PTX-2 on Clone 9 hepatocytes, respectively. Results are expressed as percentage of fluorescence in cells incubated with PTX-2 versus controls (100%). Mean±s.e.mean for n ⩾3 experiments.

