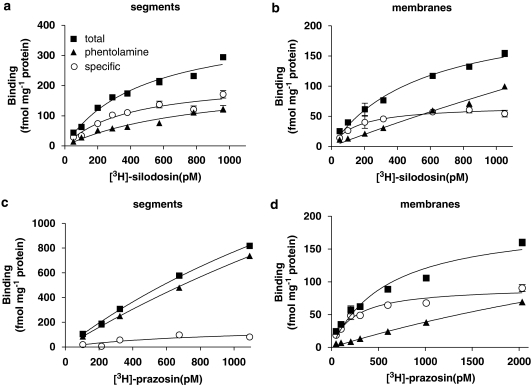
Figure 1.
Binding of [3H] silodosin (a, b) and [3H]-prazosin (c, d) to rabbit prostate. Saturation binding curves in intact segments (a, c) and crude membranes (b, d) of rabbit prostate. The ordinate scale represents binding (fmol mg−1 total tissue protein). The specific binding was determined by subtracting the amount bound in the presence of 30 μM phentolamine (non-specific binding) from the total amount bound. Each point represents the mean of duplicate determinations. Each figure is representative of similar results obtained in four separate experiments.

