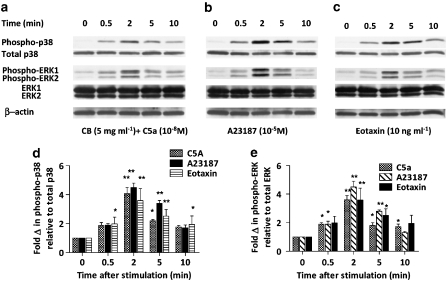
Figure 7.
p38 and ERK1/2 MAP kinase phosphorylation in activated eosinophils. Eosinophils were cultured in vitro for 16 h and stimulated with (a) CB+10−8 M C5a (as described in Figure 3), (b) 10−5 M calcium ionophore A23187or (c) 10 ng mL−1 eotaxin for 0, 0.5, 2, 5 or 10 min. After the indicated length of activating time, the cells were harvested and lysed for western blot analysis, as described in the Materials and methods. The same membrane was used to detect phospho- and total p38, phospho- and total ERK1/2 and β-actin. Representative images of five independent sets of experiments are shown. The bar graphs below each blot summarize (n=5) the fold change of phospho p38 (d) or ERK1/2 (e) versus no activation control after normalization to total p38 or ERK1/2, respectively. *P<0.05, **P<0.01 versus the untreated activated sample after ANOVA analysis (P<0.01).

