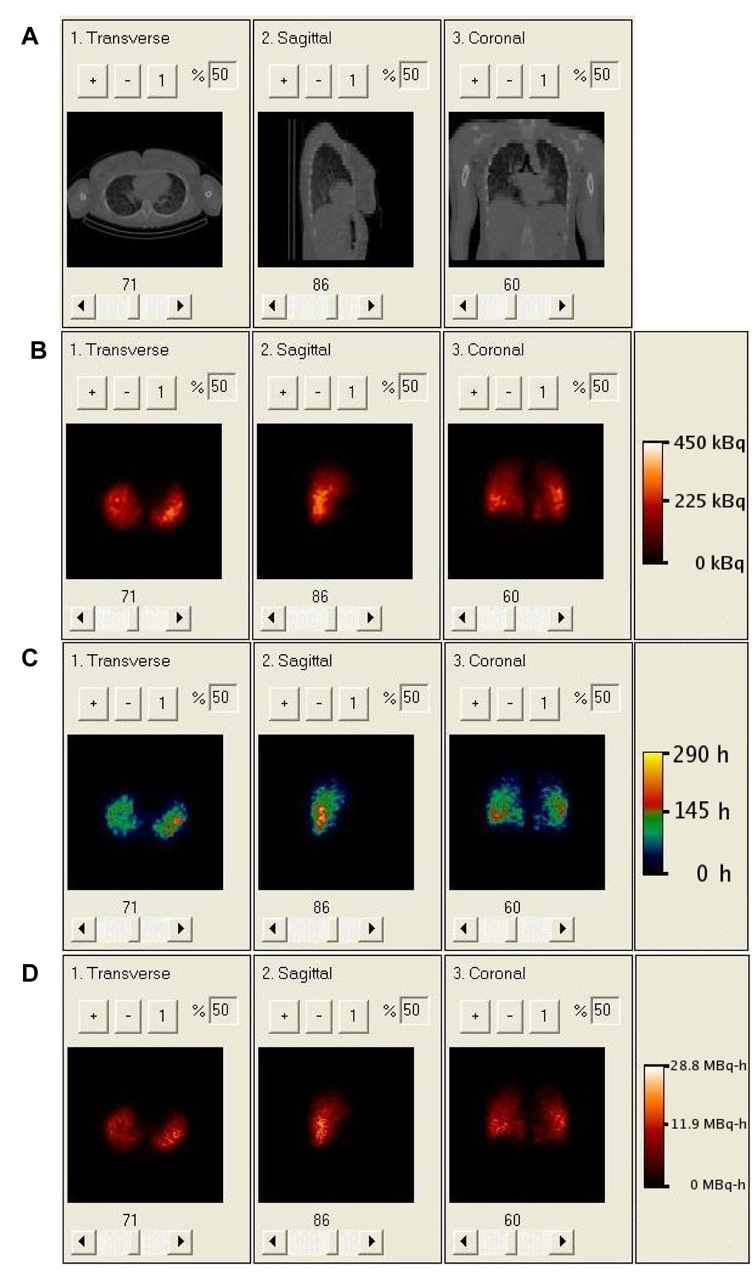
Figure 5.
A. Clinical CT of patient showing non-uniform density distribution in lungs. B. Clinical SPECT of patient showing non-uniform activity distribution. C. Rate map generated from 3 longitudinally aligned SPECT images; regions with effective half-life greater than the physical half-life of 131I reflect tumor uptake. D. Cumulative activity image generated from rate map and SPECT.

