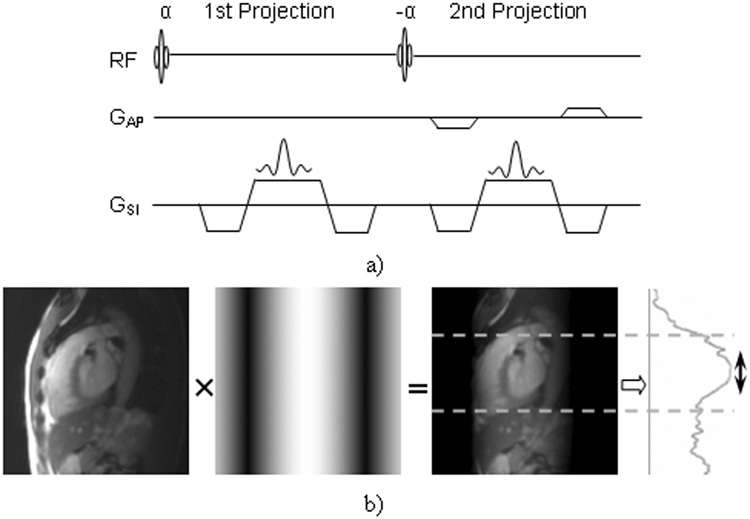
Figure 1.
a) Sequence diagram for DP-RSG data acquisition. b) Graphical presentation of the DP-RSG method. The left figure is a center-slice image reconstructed using only the anterior receiver coil. Note the significant attenuation of dorsal signals. The second figure illustrates the sinusoidal magnitude modulation in the AP direction in Eq. 1. The dark and bright bands are positioned at the anterior chest wall and the heart, respectively, such that the average projection contains primarily signals originating from the heart (region between the two dashed-lines) as shown within projection at the right.

