
Fig. 1. Circadian mRNA levels of AhR- and clock-related genes in C57BL6/J SCN and liver.
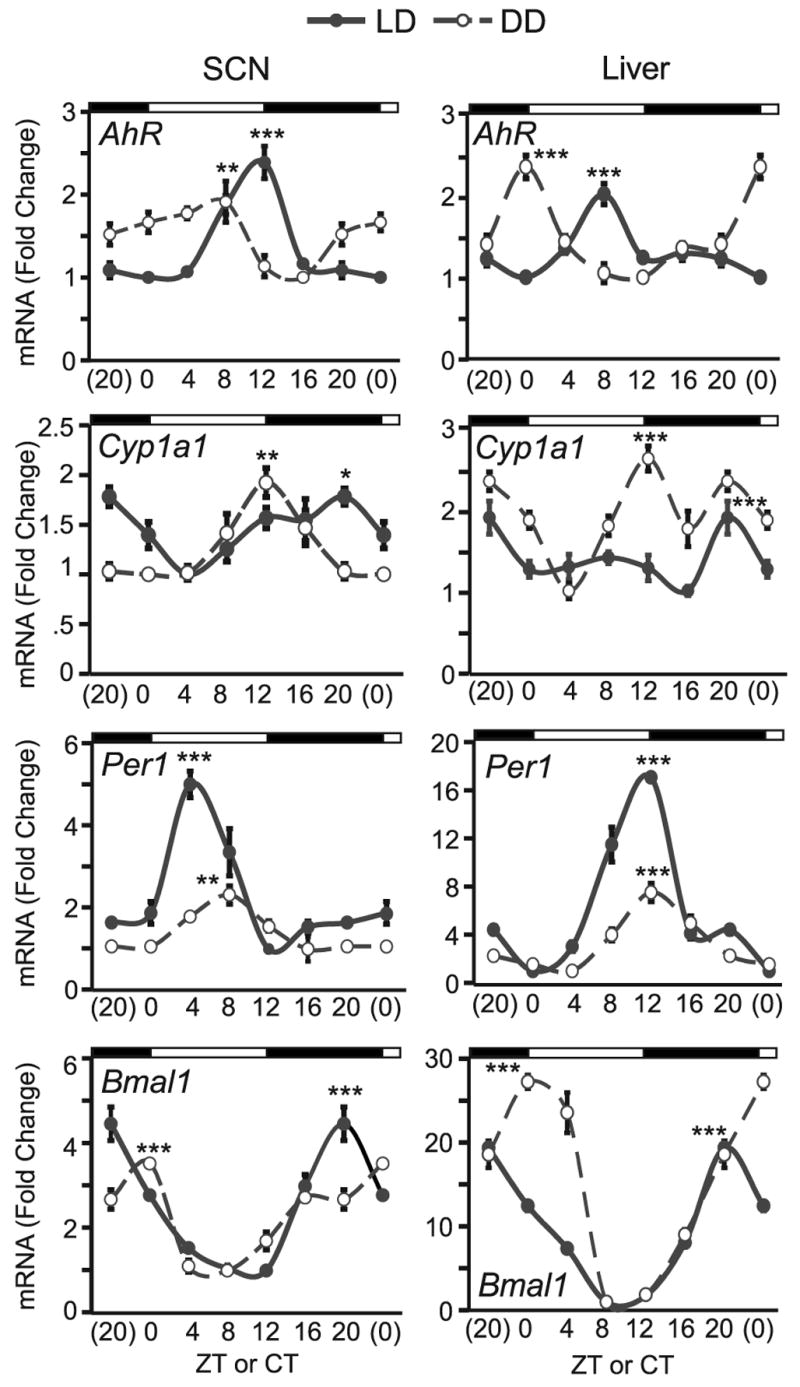
Samples were collected every 4 hours under light/darkness (L12:D12, solid line) and constant darkness (DD, dotted line) schedules. Real time RT-PCR was used to measure AhR, Cyp1a1 and Per1, Bmal1 (top to bottom). Results are shown as mean fold-change to lowest (trough) level ±SEM in SCN (left panel) and liver (right panel). Note that data at CT(ZT)0 and CT(ZT)20 are double plotted simply for easier visualization of the rhythm. The DD data was obtained from mice entrained under same lighting schedule as LD and released into DD for 48 hrs. n=3–4/group, * p<0.05, ** p<0.01, and *** p<0.001 by ANOVA in peak vs. trough expression comparison.