
Fig. 4. Effect of TCDD on light-induced phase shifts.
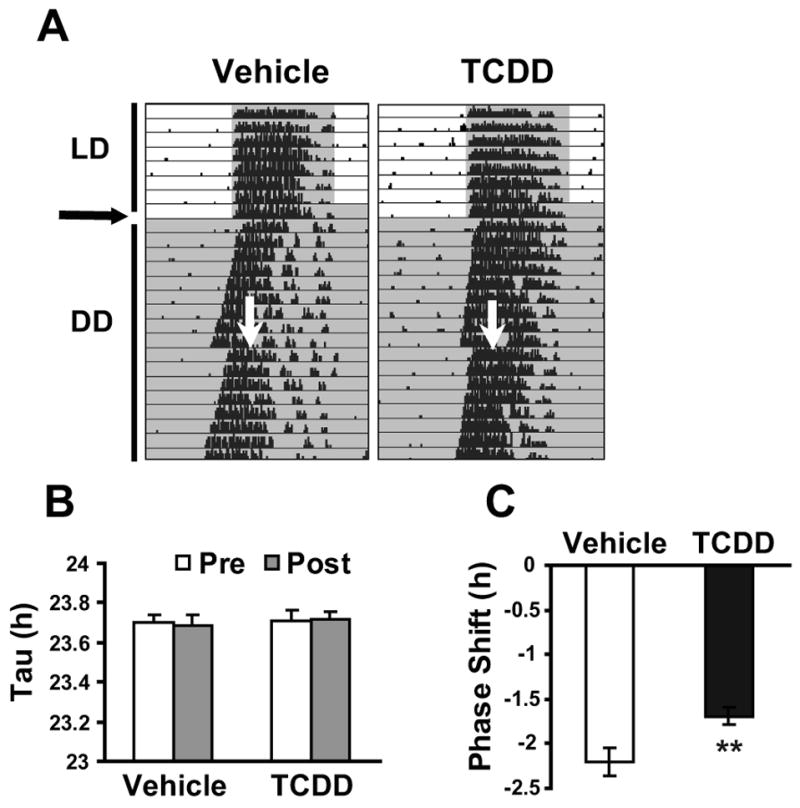
(A) Representative actogram of wheel-running activity. Mice were entrained in 12L:12D schedule and then 1μg/kg BW of TCDD or vehicle was orally exposed at horizontal arrow. Subsequently animals were placed under DD and given a 30-min light pulse at vertical arrow. (B) Circadian period pre- and post-light exposure at CT16–16.5 in vehicle and TCDD-treated mice. (C) Phase shift after light exposure at CT16–16.5 of vehicle and TCDD treated mice. n=9–10/group, **p<0.01 by t-test.