
Fig. 5. Expression of Per1 and Bmal1 mRNA in SCN and liver of AhRKO and TCDD-treated mice.
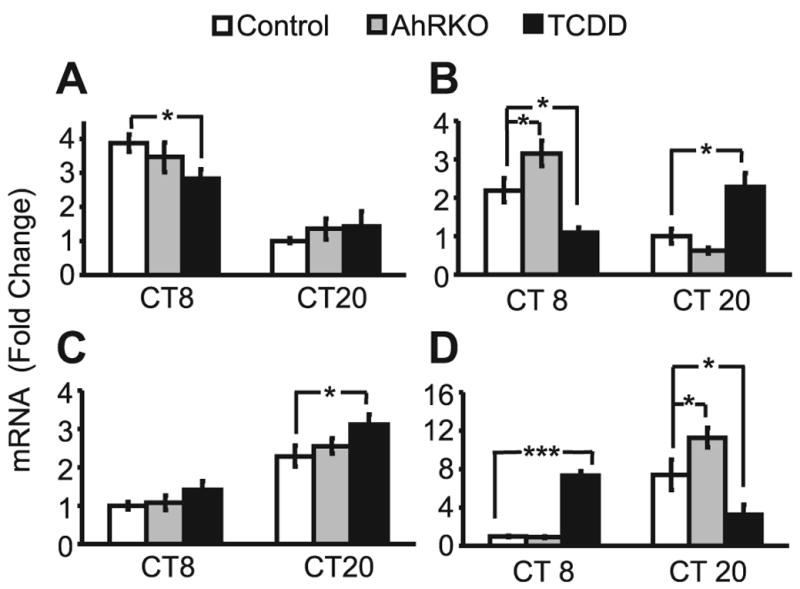
SCN and liver were collected at CT8 and CT20 during the third day in DD, from control (WT, vehicle), AhRKO (vehicle), and TCDD-treated mice. Real time RT-PCR was used to measure mRNA expression of Per1 (A,B) and Bmal1 (C, D) in SCN (A, C) and liver (B, D). Results are shown in mean fold-change compared to lowest control level ±SEM. n=4 per group. *p<0.05, **p<0.01 by ANOVA.