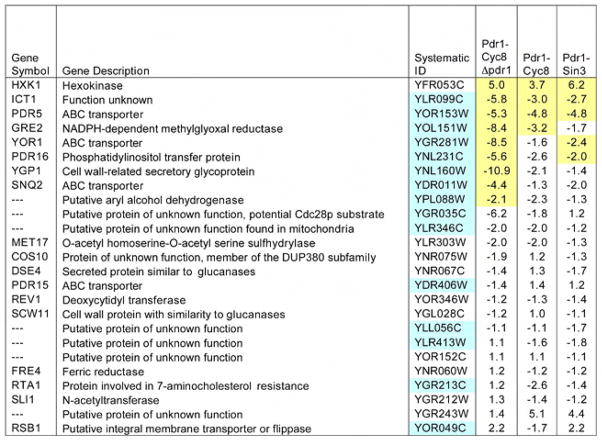
Figure 3. Expression analysis in cells containing pdr1DBD-fusion constructs. Expression analysis in cells containing pdr1DBD-fusion constructs.
Gene expression profiles were obtained by hybridization to Affymetrix YG_S98 GeneChip arrays. Profiles were obtained from three independent RNA isolations for each strain tested. Data presented are the expression profiles of genes that are upregulated by the pdr1–3 allele. The last three columns show the mean fold change relative to that of empty vector in yeast strains expressing PDR1-fusion repressors. A minus sign indicates expression was decreased relative to control. Ratios highlighted in yellow were significant at a false discovery rate (FDR) <0.05. Genes highlighted in blue contain PDR response elements in their promoter regions as reported previously(DeRisi et al., 2000; Hikkel et al., 2003). Three genes, (COS10, PDR5 and YOR1) had multiple probesets on the YG-S98 array. For these genes we reported the median change relative to vector, and highlighted that ratio when at least one of the probesets achieved the FDR<0.05. In addition to the conditions reported here, we also analyzed the effect of deletion of PDR1 in cells carrying an empty vector. The full set of expression data is available on-line (http://www.ncbi.nlm.nih.gov/geo/, GSE8326).

