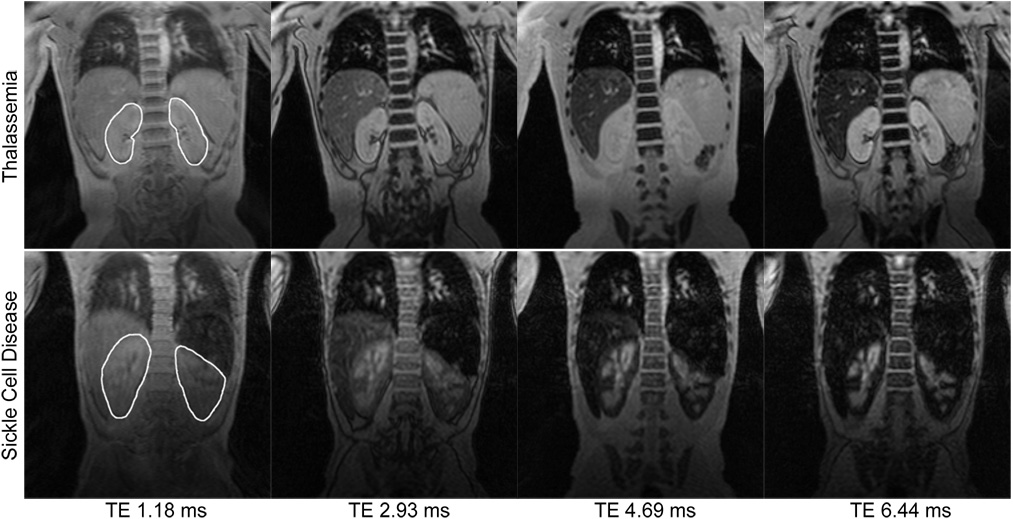
Figure 1. Comparison of kidney T2*-weighted images in sickle cell disease and thalassemia.
Representative T2*-weighted coronal MR images of the kidneys at the first four echo times (TE) from a 10-year-old with thalassemia (top) and a 14-year-old with sickle cell disease (bottom). The region of interest for analysis is shown in the leftmost images. The thalassemia and sickle cell disease patients had mean kidney R2* values of 17 Hz and 180 Hz, respectively. Note also the T2* signal attenuation in the livers of both patients and in the spleen of the SCD patient.

