
FIGURE 2. Polarization of mitochondrial membrane potential as determined by flow cytometry and confocal microscopy.
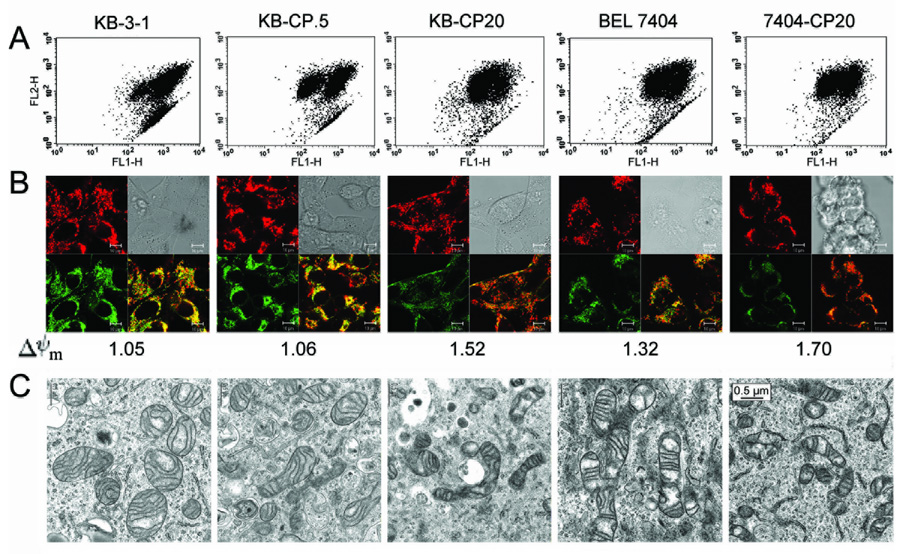
A. Mitochondrial membrane potential measured by flow cytometry. B. Mitochondrial membrane potential measured by confocal microscopy. Orange color indicates the combination of red [CBIC2(3) monomer] and green [CBIC2(3) aggregate]. Number means the relative arbitrary mitochondrial membrane potential value quantitated by confocal microscopy. C. Morphology of mitochondria in CP-s and CP-r cells observed by Electron Microcopy. Representative images from experiments performed in triplicate.