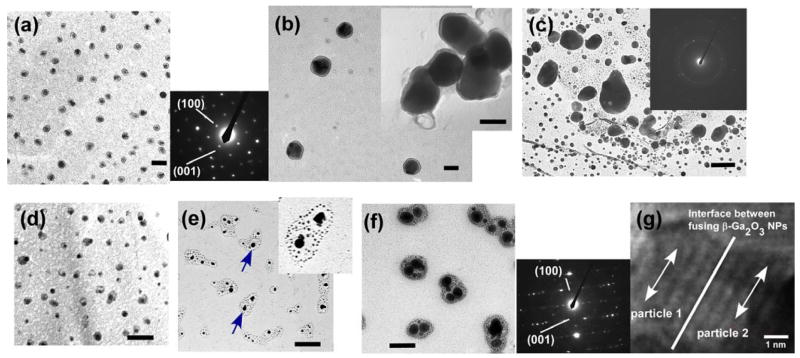
Figure 2.
TEM image of β-Ga2O3 nanoparticles after four weeks of hydrolysis with the peptide (a) in low magnification and the SAED pattern. Scale bar = 100 nm. (b) in medium magnification (inset: high magnification). Scale bar = 50 nm. (c) TEM image of GaOOH particles grown without the peptide and the SAED pattern. Scale bar = 80 nm. (d) TEM image of GaOOH nanoparticles grown after one week of hydrolysis with peptides. Scale bar = 20 nm. (e) TEM image of nanoparticles grown with the peptide after two weeks (inset: high magnification). Scale bar = 50 nm. (f) TEM image and SAED pattern of β-Ga2O3 nanoparticles after three weeks of hydrolysis with peptides. Scale bar = 50nm. (g) HRTEM of fusing β-Ga2O3 nanoparticles. (200) lattice faces for both particles 1 and 2, shown by arrows, are aligned parallel to the particle-merging interface.

