
Figure 4.
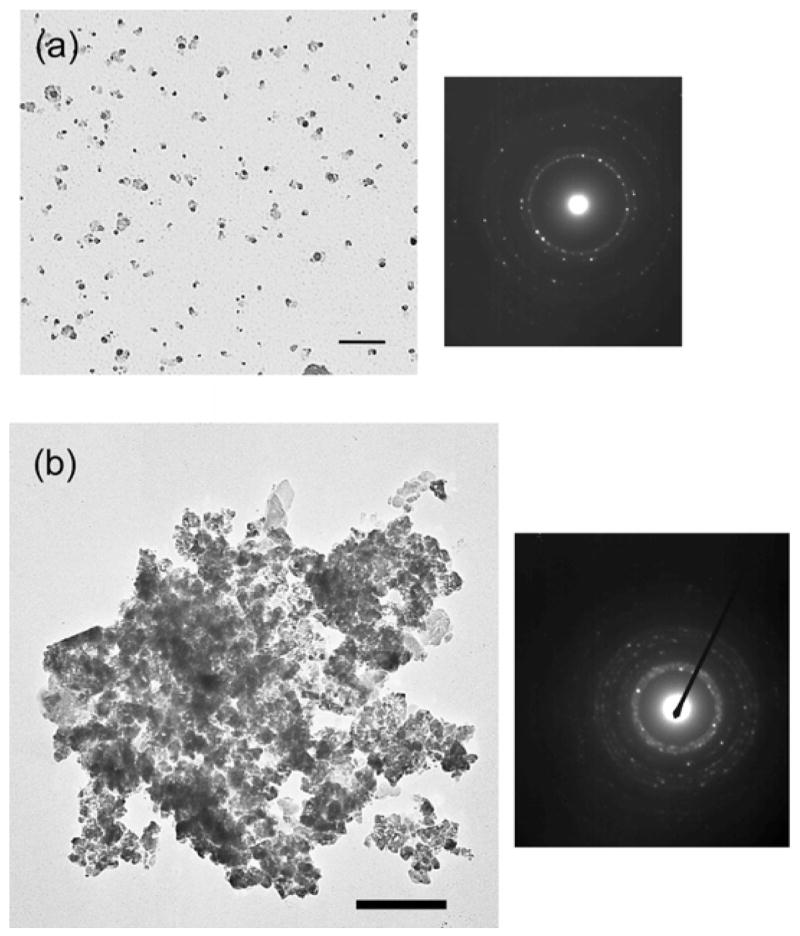
TEM images and electron diffractions of (a) GaOOH particles obtained after four weeks of hydrolysis with the peptide at neutral pH. Scale bar = 100 nm. (b) GaN particles obtained after the sintering of Ga2O3 nanoparticles under NH3 at 900 °C. Scale bar = 200 nm.