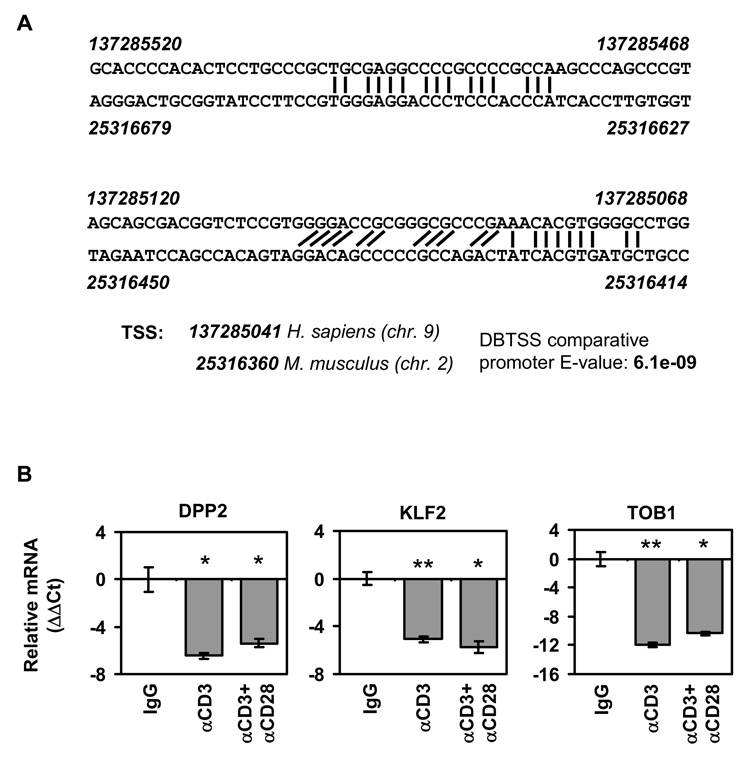
Figure 4. Lymphocyte activation results in reduced levels of DPP2 mRNA.
A) GC-rich regions in proximal promoter region of mouse and human DPP2 are well-conserved. Numbers represent nucleotide positions in DBTSS (http://dbtss.hgc.jp). Transcription start sites, and expectation score (E-value) for the alignment of the two promoters are from DBTSS. B) Lymphocytes were stimulated for 96 h with anti-CD3 mAb alone or in combination with anti-CD28 mAb, or with isotype-matched control antibody (IgG). RNA was collected and real-time RT-PCR, performed using human DPP2, KLF1 or TOB1 TaqMan probes. Results are shown as mean ΔΔCt +/− SD from triplicate samples, normalized first against 18S RNA, then against the IgG control sample. *, p<0.05; Student’s two-tailed t test, **, p<0.005; Student’s two-tailed t test.

