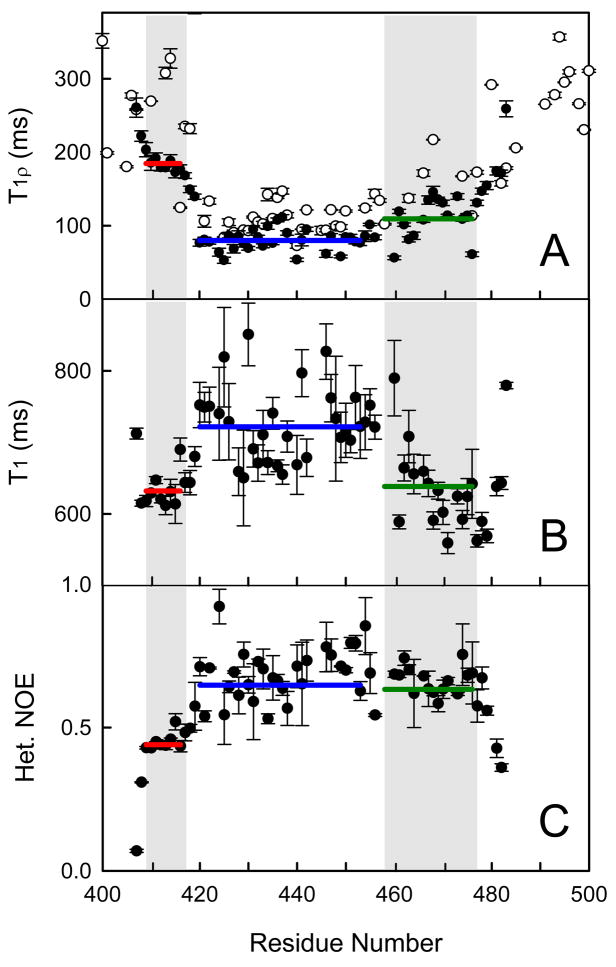
Figure 2.
15N backbone relaxation data showing several areas of cooperative motion in the Aα406-483 fragment (filled circles). T1ρ (panel A), T1 (panel B) and NOE (panel C) relaxation data are shown. The T1ρ data for the Aα374-538 fragment (open circles in panel A) are shown for comparison. Horizontal lines show the average values for the region corresponding to the previously identified disulfide-linked β-hairpin (blue), and the NH2-terminal (red) and hydrophobic collapsed (green) regions shaded in gray. Vertical bars represent experimental errors.

