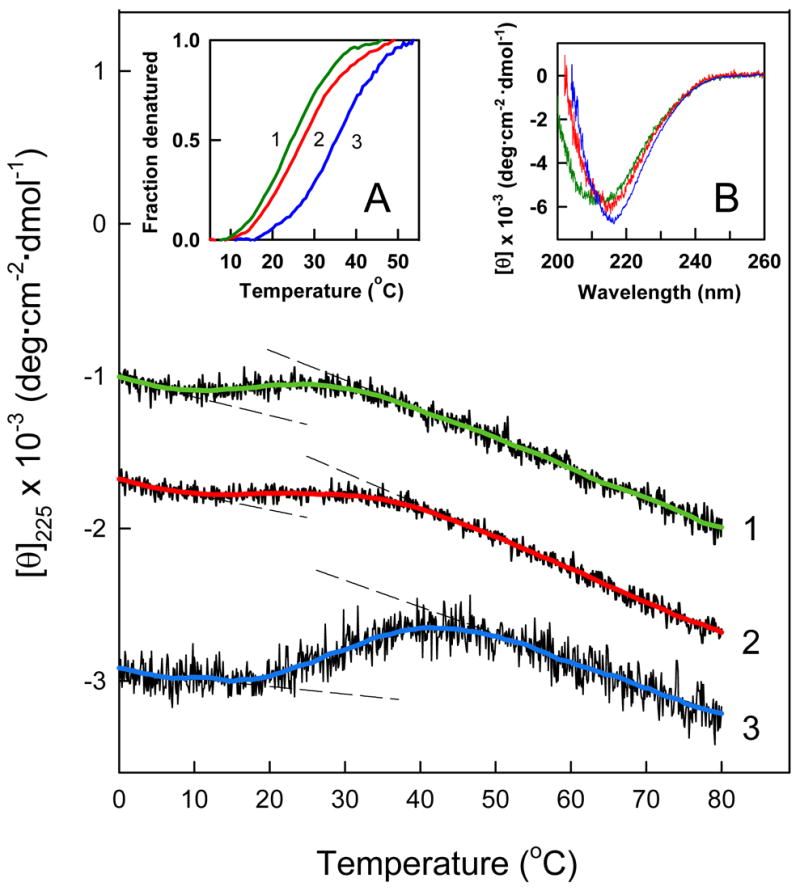
Figure 6.

CD-detected thermal unfolding of the Aα406-483 fragment. The unfolding experiments were performed at 1.5, 3.0 and 6.2 mg/mL Aα406-483 (curves 1, 2 and 3, respectively) in TBS. The unfolding curves have been arbitrary shifted along the vertical axis to improve visibility and smoothed (colored curved lines) to reduce the noise. The dashed straight lines represent the results of fitting of pre- and post-transition data; they provide the basis for estimating the fraction denatured at 1.5 (green curve 1), 3.0 (red curve 2) and 6.2 mg/mL (blue curve 3) presented in the inset A. The CD spectra presented in inset B were obtained at the same three concentrations of Aα406-483, 1.5 (green), 3.0 (red) and 6.2 mg/mL (blue) in PBS at 4 °C.
