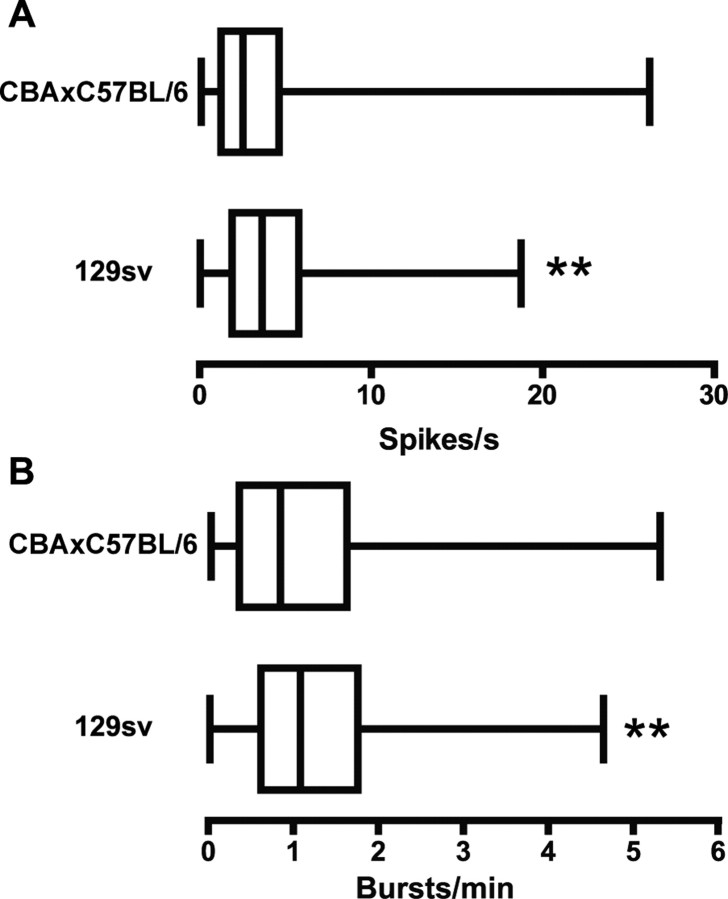
Figure 3.
Comparison of WT littermate controls between the two mouse models of HD. Data in A and B are presented as box-and-whiskers plots. The left edge of the box is the 25th percentile, the center line is the median (50th percentile), and the right edge is the 75th percentile. The far left whisker extends to the lowest value in the distribution and the far right to the highest value. Asterisks indicate statistically significant differences between medians based on a Mann–Whitney U test. A, WT mice from the KI line (129sv) had a significantly faster spontaneous firing rate than those from the R6/2 line (CBA × C57BL/6; **p < 0.01). B, 129sv mice had a significantly greater burst rate than CBA × C57BL/6 mice (**p < 0.01).

