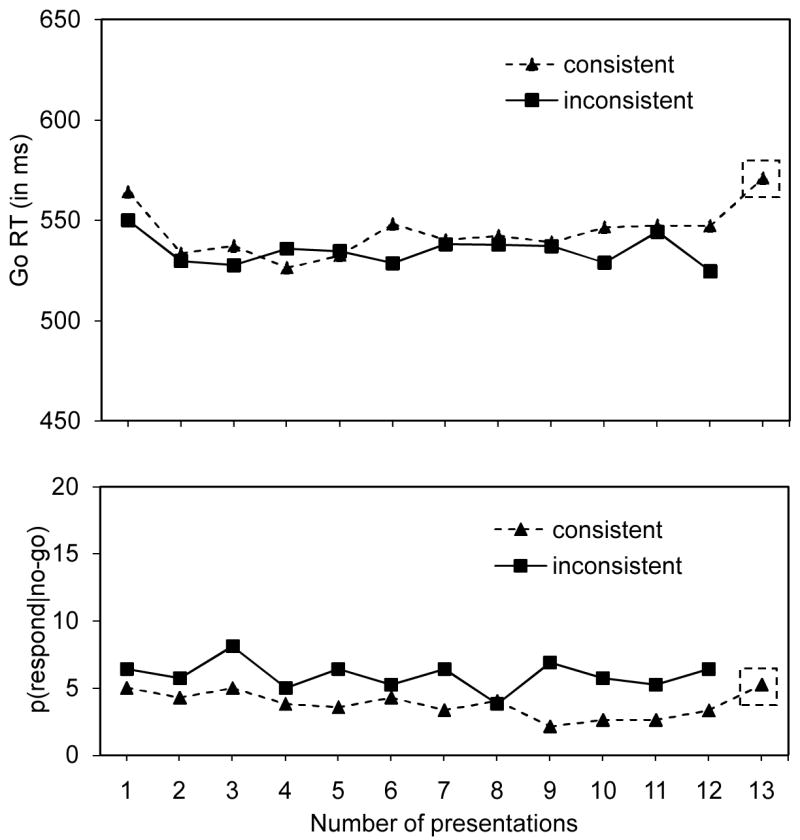
Figure 3.

go RTs (in ms; upper panel) and p(respond|no-go) data (in %; lower panel) for the consistent-stimulus-goal-mapping condition and the inconsistent-stimulus-goal-mapping-condition as a function of the number of presentations in Experiment 3. Data of the test phase in the consistent-stimulus-goal-mapping condition appear in the little square with dashed contours.
