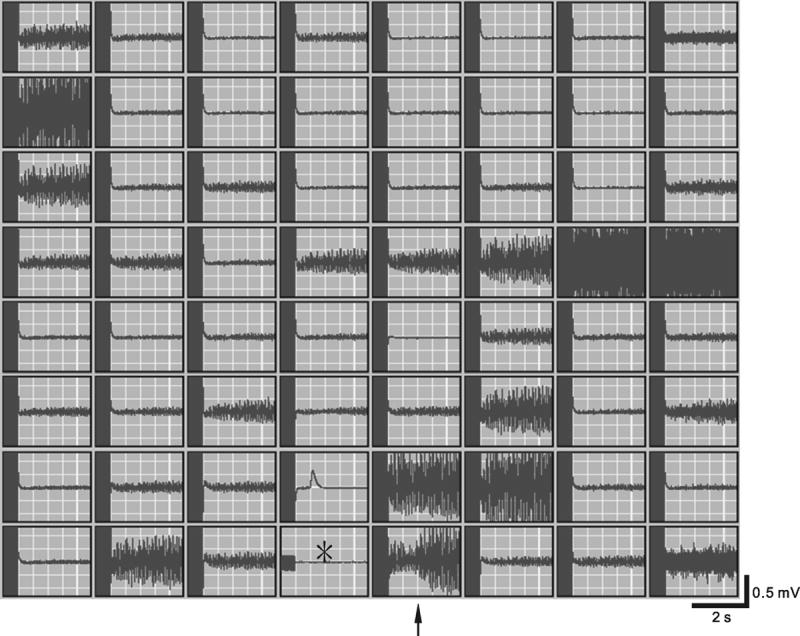
Figure 4.

Extracellular recordings of electrical activities in a RA-LA-PV preparation with a MED64 system. The 64 traces were aligned vertically and horizontally. Origin of electrical stimulation is indicated by the star located in the central bottom block. In each set of traces, the end of stimulation artifacts (10-30 Hz for 3 s) was followed by responses to the fast pacing. The trace (indicated by an arrow) to the right of the site of electrical stimulation was magnified and shown in Figure 5.
