
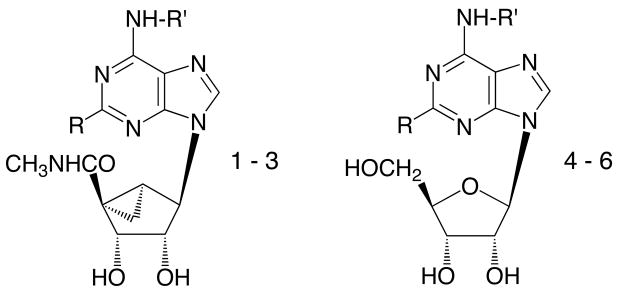
Table 1.
Potency of adenosine derivatives at human A1, A2A, and A3ARs and the rat A3AR a and maximal agonist effects at human A3ARs expressed in CHO cells.a
 | |||||||
|---|---|---|---|---|---|---|---|
| No. | N6-R′ | C2-R | Ki (hA1AR) nMa | Ki (hA2AAR) nMa | Ki (hA3AR) nMa | % Activation (hA3AR)b at 10 μM | Ki (rA3AR) |
| 1c | CP | H | 34.1 ± 6.1 | 6420 ± 630 | 13.1 ± 5.1 | 93 ± 7 | 10.2 ± 2.1 |
| 2c | CP | Cl | 18.3 ± 6.3g | 3250 ± 300 | 3.7 ± 0.9 | 101 ± 10 | 5.8 ± 1.6 |
| 3c | NB | Cl | 190 ± 37 | >10,000 | 14.6 ± 3.2 | 92 ± 6 | 9.6 ± 2.7 |
| 4d | CP | H | 0.45±0.04b | 462 | 240±36 | 72±12 | 97±4 |
| 5d | CP | Cl | 0.83e | 2270e | 38 ± 6 | 0 | 237±71f |
| 6d | NB | H | 0.48±0.01 | >10,000 | 229±76 | 112±25 | 103±1 |
All AR experiments were performed using adherent CHO cells stably transfected with cDNA encoding the human or rat ARs. Percent activation of the human A3AR was determined at 10 μM. Binding at human A1 and A2AARs in this study was carried out as described in Methods using [3H]R-PIA or [3H]CGS 21680 as a radioligand. Values from the present study are expressed as mean ± s.e.m., n = 3–5.
Percent activity at 10 μM, relative to 10 μM Cl-IB-MECA (A3).
1, MRS3706; 2, MRS3630; 3, MRS3638.
Data from Klotz et al.28
Data from van Galen et al.29
Ki at rat A1 AR is 17.4 ± 2.7 nM.
ND not determined. CP, cyclopentyl; NB, 7-norbornyl.