
Figure 3.
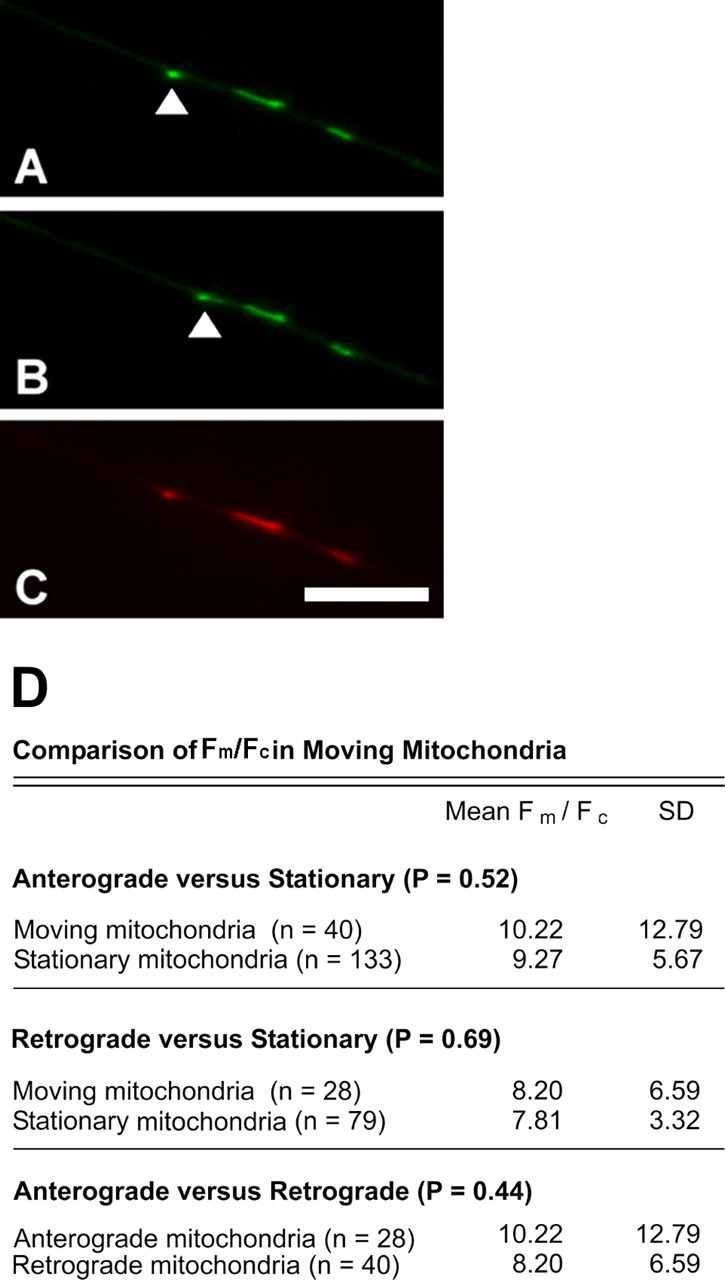
Comparison of Fm/Fc between anterogradely moving, retrogradely moving, and stationary mitochondria shows no difference in Fm/Fc. Mitochondria were stained with both Mitotracker and TMRM. A, B, Imaging of Mitotracker shows the position mitochondria along the axon; these two images were acquired 60 s apart. A single moving mitochondrion is highlighted with an arrow. C, TMRM staining of the same field in A indicates Fm/Fc. Scale bar, 10 μm. D, Comparisons of populations of mitochondria using a paired t test shows that the Fm/Fc does not vary between stationary and moving mitochondria, or between anterogradely and retrogradely moving mitochondria. n = 33 and 21 cells for that containing anterogradely or retrogradely moving mitochondria, respectively.