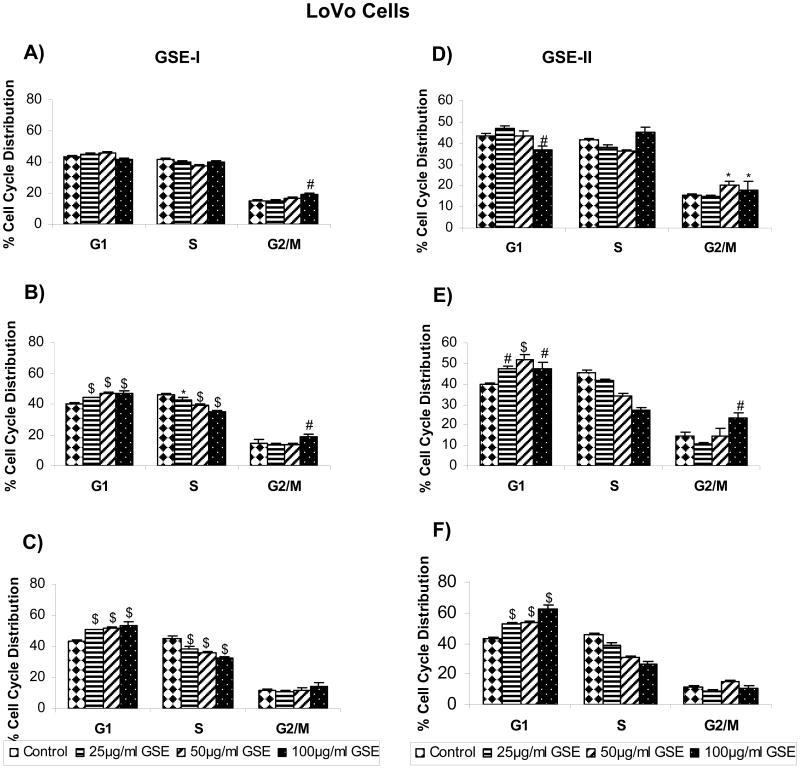
FIG. 1.
GSE-I and GSE-II preparations induce cell cycle arrest in LoVo cells. Cells were plated as described in the Materials and Methods and treated with either DMSO alone (control) or varying concentrations of GSE-I or GSE-II (25-100μg/ml) for 12, 24 and 48h. At the end of these treatments, cells were collected and incubated with saponin/PI solution at 4°C for 24 h in dark and subjected to FACS analysis as detailed in the Materials and Methods. Panels A, B and C represent data for GSE-I at 12, 24 and 48h, and panels D, E and F represent data for GSE-II at 12, 24 and 48h of treatment, respectively. The data shown are mean ± SD of three independent plates. *, P < 0.05; #, P < 0.01; and $, P < 0.001, control (DMSO) versus various GSE-I/GSE-II treatments as indicated in the figure.

