
Figure 3.
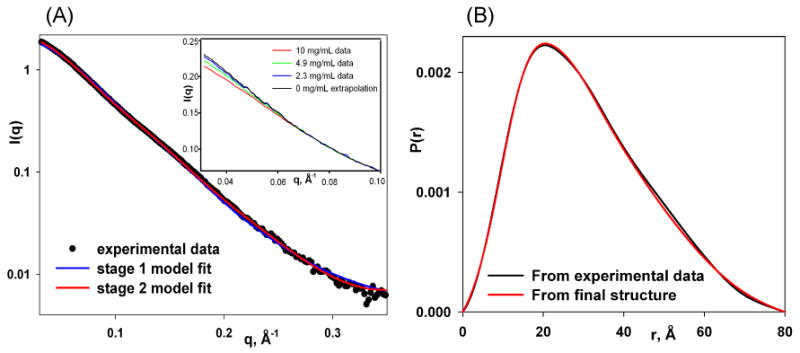
SAXS data for tRNAVal. (A) Desmeared experimental scattering data extrapolated to zero concentration, and their fit to the starting (stage 1; χ ∼ 2.8) and refined (stage 2; χ ∼ 0.9) tRNAPhe-based models. The inset shows the effect of the structure factor on the raw line-smeared data as a function of concentration. (B) Pairwise distance distributions, P(r), obtained from the Fourier transforms of the zero-concentration-extrapolated data, and the scattering data simulated from the final stage 2 model (red).