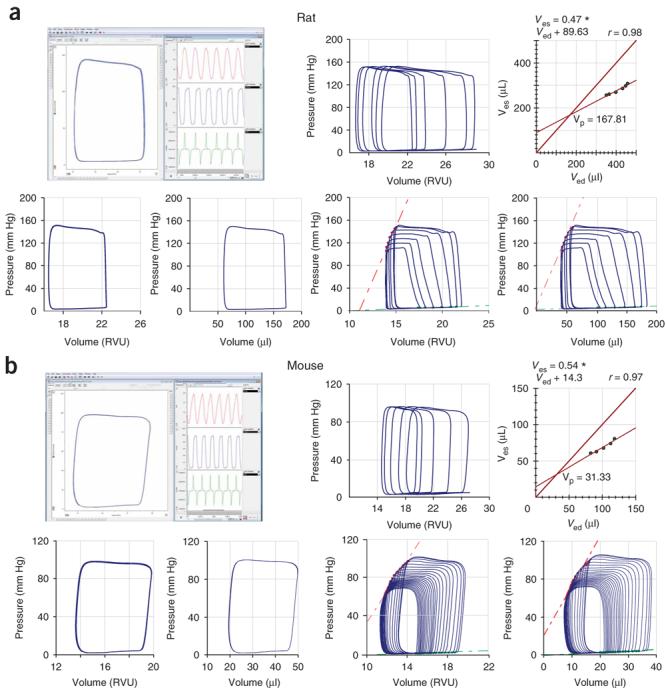
Figure 5.

Representative examples of rat and mouse baseline PV loops and occlusions. Examples show representative (a) rat and (b) mouse PV loops before the calibration (in RVUs) and following cuvette and saline calibrations (in microliters) obtained by closed-chest approach with Millar PV system and analyzed by PVAN3.5. Upper rows (a and b), left-hand panels show examples of baseline uncalibrated PV loops (rectangular shape, left side of the panel), volume signal (red trace), pressure signal below volume (blue trace) and +dP/dt and −dP/dt derived from the pressure signal (green trace). Upper rows (a and b) in middle and right show examples of hypertonic saline injections (rightward ship of PV loops without decrease in the amplitude) and derived Vp values. Lower rows (a and b) show uncalibrated (in RVUs) and calibrated (in microliters) normal rat and mouse baseline PV loops (left two panels) and loops following inferior vena cava occlusions (right two panels) See also Supplementary Movies 2 and 4 online, and Figure 6a.
