Figure 1.
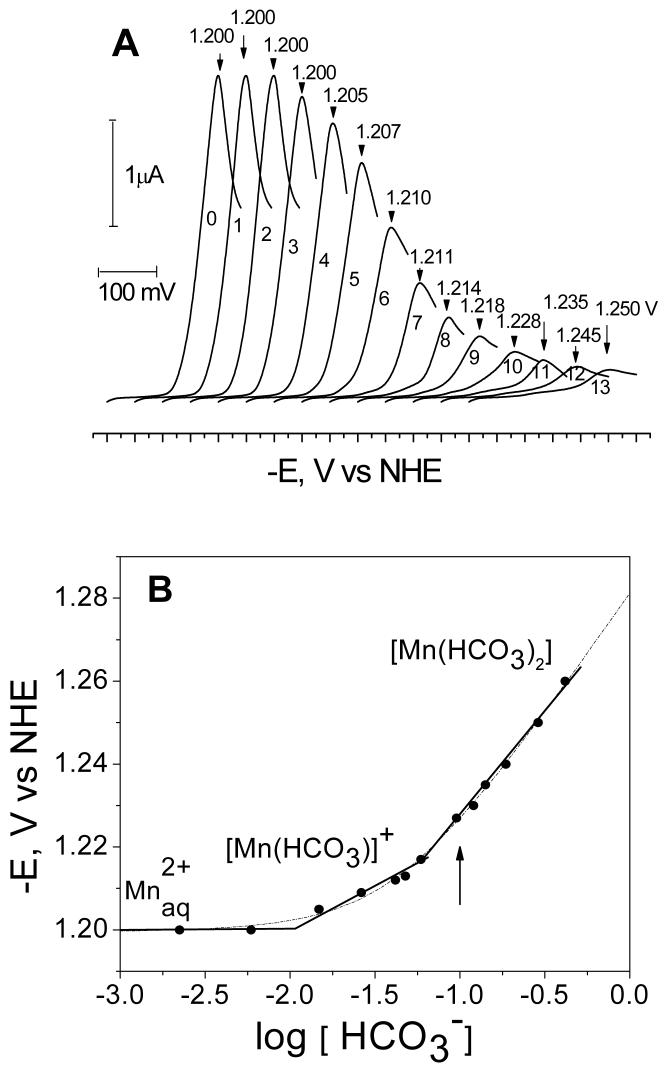
(A) Voltage-current curves of Mn2+ (0.25 mM MnSO4) reduction in aqueous solutions of 0.1 M LiClO4 at different concentrations of added NaHCO3: 0 mM (curve 0); 2.91mM (curve 1); 5.81mM (curve 2); 8.72 mM (curve 3); 17.4 mM (curve 4); 26.2 mM (curve 5); 37.8 mM (curve 6); 49.4 mM (curve 7); 78.5 mM (curve 8); 113 mM (curve 9); 157 mM (curve 10); 209 mM (curve 11); 296 mM (curve 12); 381mM (curve 13). The curves are shifted on the x-axis for clarity. The peak potentials are indicated at the top of each curve. (B) Peak potentials (Ep) from (A) are plotted as a logarithmic function of bicarbonate concentration (see Fig 1A for experimental conditions). The data fits are shown using the Lingane (solid line) and DeFord-Hume (dashed line) equations, in the later case the speciation model of Eqn. (7) was assumed. Also shown are the major species at each concentration range. The arrow shows the bicarbonate concentration at which the pulsed EPR measurements were carried out.

