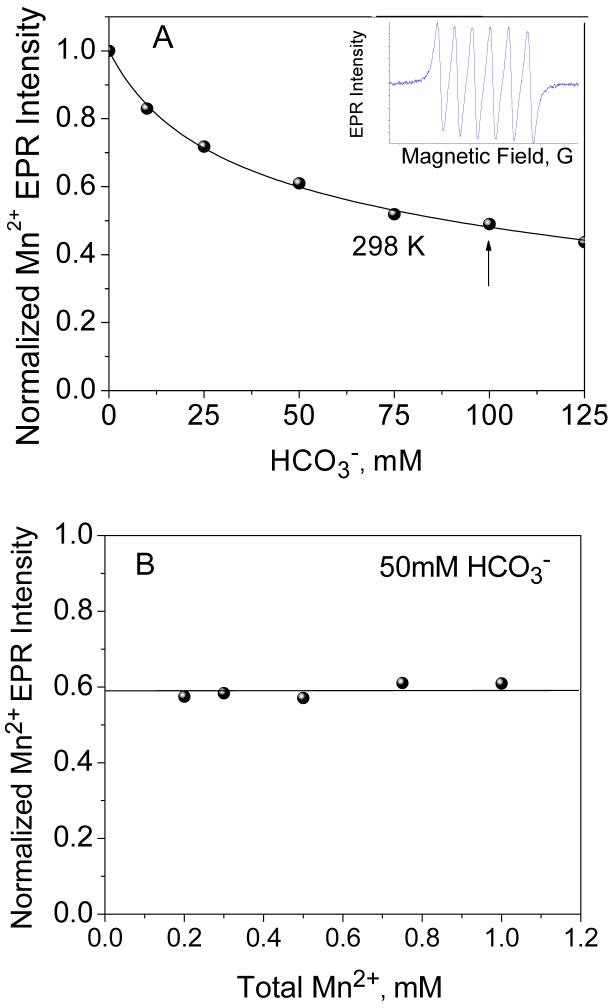
Figure 2.
(A) Dependence of the Mn2+ EPR signal intensity on bicarbonate concentration in aqueous solution at room temperature (Mn2+ concentration 0.5 mM, pH 8.3). Fit to an equilibrium model described in Eqn. 8 is shown with solid line. Inset shows typical Mn2+ EPR signal in aqueous solution centered at g 2.0. (B) Dependence of the Mn2+ EPR signal intensity (normalized to total amount of Mn2+ in the sample) as a function of Mn2+ concentration at fixed 50 mM NaHCO3 in aqueous solution at room temperature. The straight line shows the invariance on Mn2+ concentration, clearly eliminating the presence of any Mn2+ clusters in speciation.

