
Figure 4.
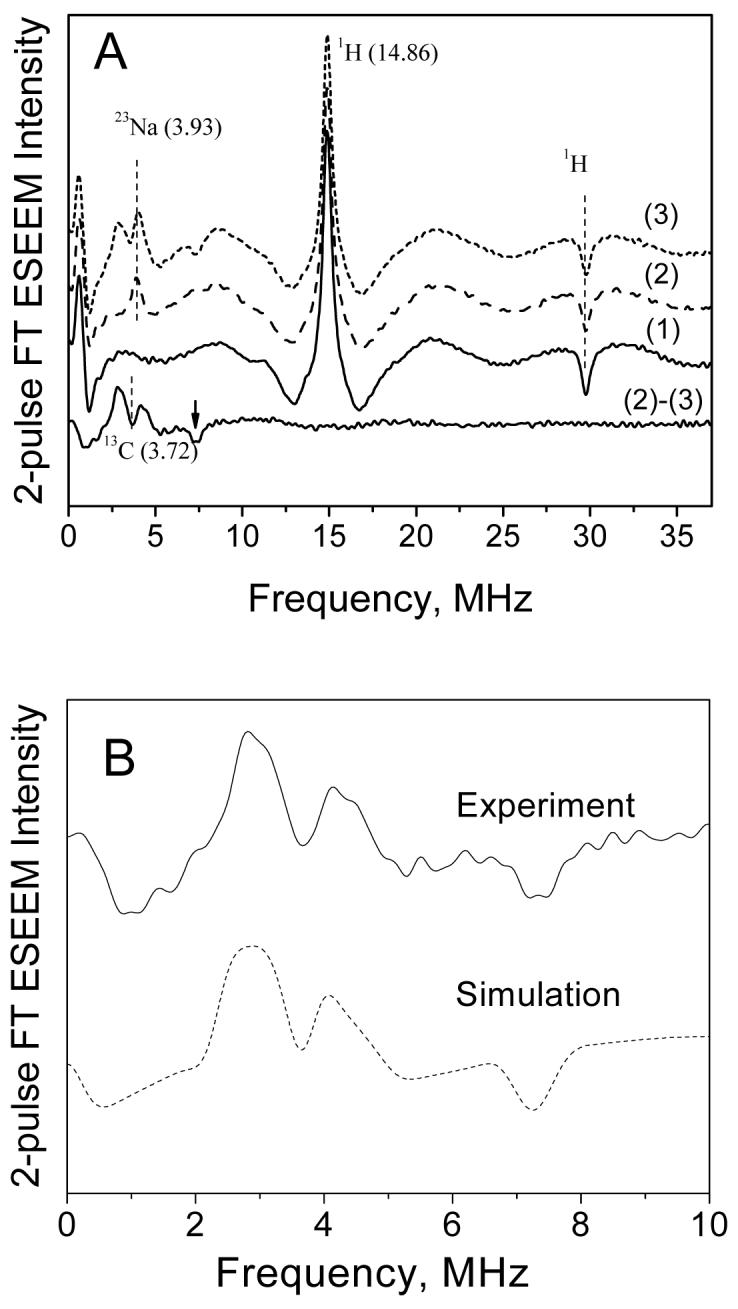
(A) Cosine FT traces of 2-pulse ESEEM of Mn2+ (0.5 mM) in frozen glass solution (H2O/CH3OH) recorded at 3490 G and 10 K. Trace (1) no added bicarbonate, trace (2) 100mM NaH12CO3, and trace (3) 100mM NaH13CO3. Trace (2)-(3) at the bottom is the difference spectrum of (2) and (3) and shows the nuclear spin transitions arising only from 13C nuclei (this difference spectrum is also shown in (B)). The vertical lines show the positions of Zeeman frequencies for 1H, 23Na and 13C nuclei at 3490 G. The arrow indicates the sum combination line of 13C. (B) Comparison of experimental (solid line) and simulated (dash-dot line) 13C ESEEM spectra. Simulation parameters are shown in Table 2.