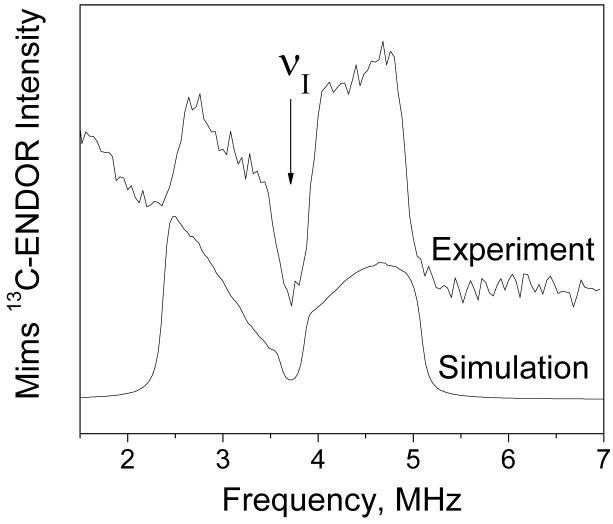
Figure 5.
Experimental (top trace) and simulated (bottom trace) Mims 13C ENDOR spectra of Mn2+ (0.5 mM) in frozen glass solution (H2O/CH3OH) at 3490 G and 10 K. The experimental spectrum was obtained by subtraction of the spectra recorded using 13C and 12C-labeled bicarbonate. The vertical arrow labeled νI indicates the position of 13C Zeeman frequency at 3490 G. Simulation parameters are given in Table 2.

