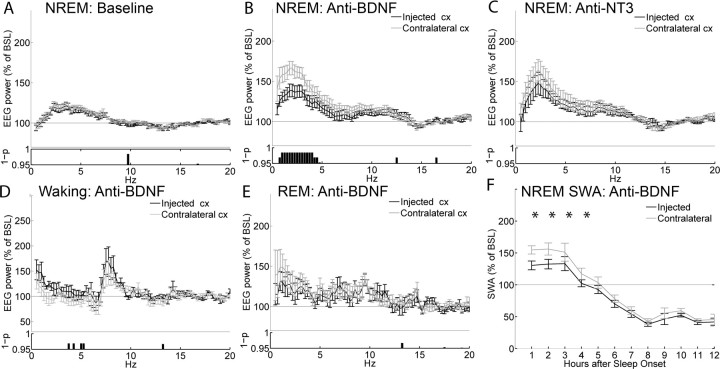
Figure 4.
Effects of the anti-BDNF antibody on the EEG power spectrum. EEG power spectrum during NREM sleep in baseline (A) and after injection of anti-BDNF (B) or anti-NT3 (C). All data are mean ± SEM for the first 2 h after sleep onset. For each frequency bin (0.25 Hz), values are expressed as percentage of the NREM EEG power spectrum during the first 6 h of baseline (BSL), normalized for the mean power density in the 15–20 Hz range within each interval. The bottom panels show the statistical significance for each frequency bin, comparing the injected with the contralateral hemisphere (p < 0.05, Wilcoxon's nonparametric test). Note that the higher EEG power in the low frequencies after vehicle injections relative to baseline is expected, because rats were awake longer. D, EEG power spectrum during waking for the first 3 h after the injection of anti-BDNF. E, EEG power spectrum during REM sleep during the first 2 h of sleep after the injection of anti-BDNF. F, Time course of the changes in NREM SWA after the injection of anti-BDNF (Bonferroni's post hoc between injected and contralateral hemispheres, *p < 0.01, for the first four 1 h intervals after two-way rANOVA; F(11,66) = 7.3; p < 0.00001). SWA is expressed as the mean value of relative normalized NREM EEG power across frequencies ranging from 0.5 through 4 Hz. Data in all panels refer to n = 7 rats.

