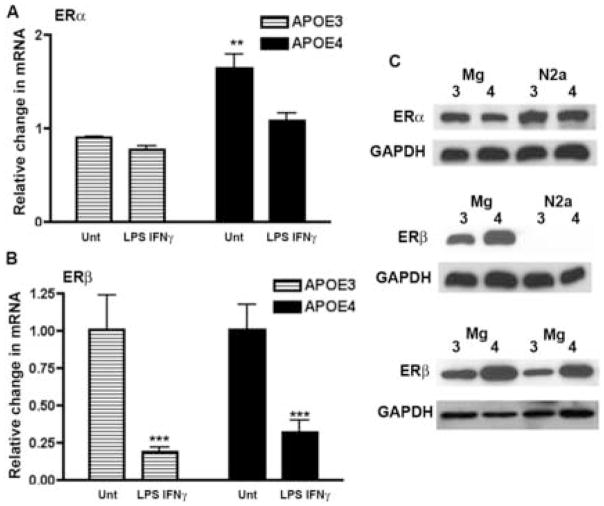
Figure 3. Expression of mRNA and protein for ERα and ERβ in microglia from APOE3 and APOE4 mice.
(A and B) Quantitative RT-PCR was used to measure the average fold change (±SEM) in ERα and ERβ mRNA in microglia using untreated APOE3 as the calibrator. (A) Basal (untreated) levels of ERα mRNA were significantly higher in APOE4 microglia. Significance was determined using 2-way ANOVA with the Bonferroni post-hoc test. A significant effect of genotype was observed (p = 0.0025) for n = 7–12 cultures from a minimum of 3 different litter groups per genotype; ** = p < 0.01 for APOE4 compared to APOE3. (B) No significant difference was observed between untreated or treated APOE3 and APOE4 ERβ mRNA levels. A significant effect of LPS+IFNγ treatment compared to untreated was observed for both APOE3 and APOE4 mRNA (*** = p< 0.001). (C) ERα (top panel) and ERβ (middle and bottom panels) protein levels in untreated microglial lysates were determined using Western blot (labeled- Mg) from APOE3 (labeled- 3) and APOE4 (labeled- 4) mice. For ERβ, blots are presented from 3 different untreated microglial litter groups. Permanently transfected neuronal cells derived from the N2a cell line expressing human APOE3 (labeled -3) or human APOE4 (labeled -4) [6] were used as controls to demonstrate ER antibody specificity. N2a cells only express ERα and do not express ERβ. GADPH served as a loading control.

