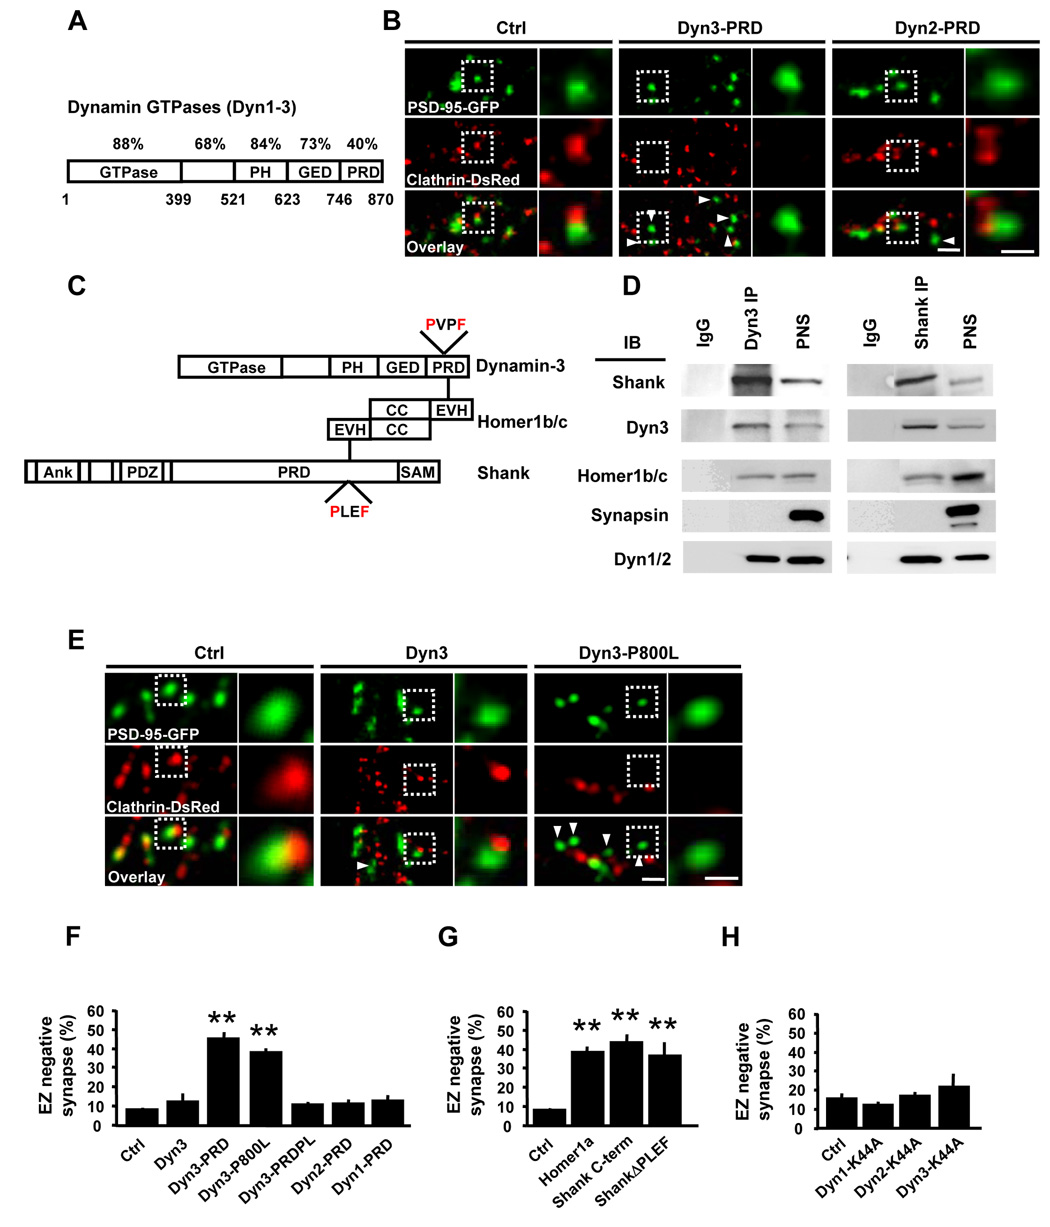
Figure 4. A Dyn3-Homer-Shank Protein Complex Couples the EZ and the PSD.
(A) Schematic diagram of dynamin family GTPases illustrating their domain organization. The percent amino acid conservation between dynamins 1–3 for each separate protein domain is indicated. PH, pleckstrin homology domain; GED, GTPase effector domain; PRD, proline-rich domain. Bottom numbers are amino acid positions corresponding to dynamin-3.
(B) Expression of Dyn3-PRD uncouples the EZ from the PSD. Images are of hippocampal neurons expressing PSD-95-GFP and clathrin-DsRed together with the indicated Flag-tagged dynamin constructs. Right panels correspond to regions in the dashed white boxes. Scale bars, 2 µm and 1 µm.
(C) Schematic representation of protein interactions linking dynamin-3, Homer1b/c, and Shank. PH, pleckstrin homology domain; GED, GTPase effector domain; PRD, proline-rich domain; EVH1, Ena/Vasp homology domain 1; PXXF, consensus EVH1-binding motifs; Ank, ankyrin repeats; PDZ, PSD-95/discs-large/ZO-1 homology domain; SAM, sterile alpha motif.
(D) Dynamin-3 forms a complex with Homer and Shank in rat brain. Immunoprecipitations (IP) were performed with antibodies against either dynamin-3 (Dyn3) or Shank or with control IgG and precipitated proteins subjected to immunoblot analysis (IB) for the indicated proteins. PNS, postnuclear supernatant.
(E) The Homer binding domain of dynamin-3 is required for PSD-EZ coupling. Images correspond to dendritic segments of hippocampal neurons expressing PSD-95-GFP (green) and clathrin-DsRed (red) along with either wildtype (Dyn3) or Homer-binding deficient mutant (Dyn3-P800L) dynamin-3 constructs. Scale bars, 2 µm and 1 µm. Arrowheads indicate EZ-negative PSD-95 puncta.
(F) Quantitative analysis of PSD-associated endocytic machinery. Data represent means ± SEM of the fraction of synapses lacking a clathrin-DsRed punctum within 0.7 µm (EZ-negative synapses) on hippocampal neurons expressing the indicated constructs. n = 134, 15, 20, 34, 27, 16, and 20 from left to right; ** p < 0.001 relative to control, t-test.
(G) Disruption of Homer and Shank interactions causes loss of the spine EZ. Data represent means ± SEM of the fraction of EZ-negative synapses on hippocampal neurons expressing the indicated constructs. n = 134, 37, 12, and 21 from left to right; ** p < 0.001 relative to control, t-test.
(H) GTPase-deficient mutant dynamins do not affect clathrin localization adjacent to the PSD. Data and analysis as in (F) and (G). n = 20, 15, 12, and 16, respectively; p > 0.05 relative to control, t-test.

