
Fig. 3.
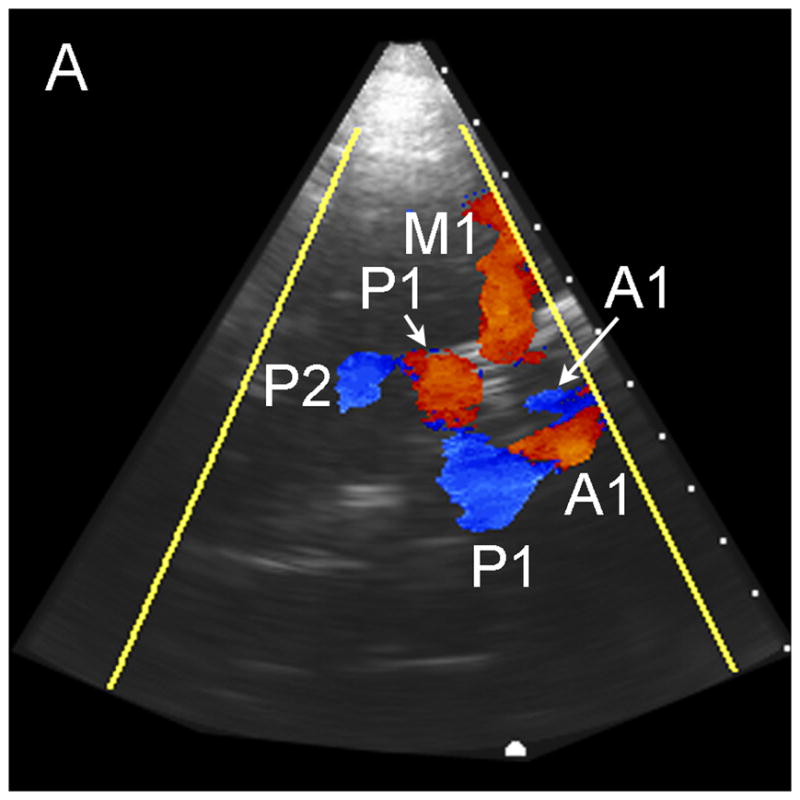
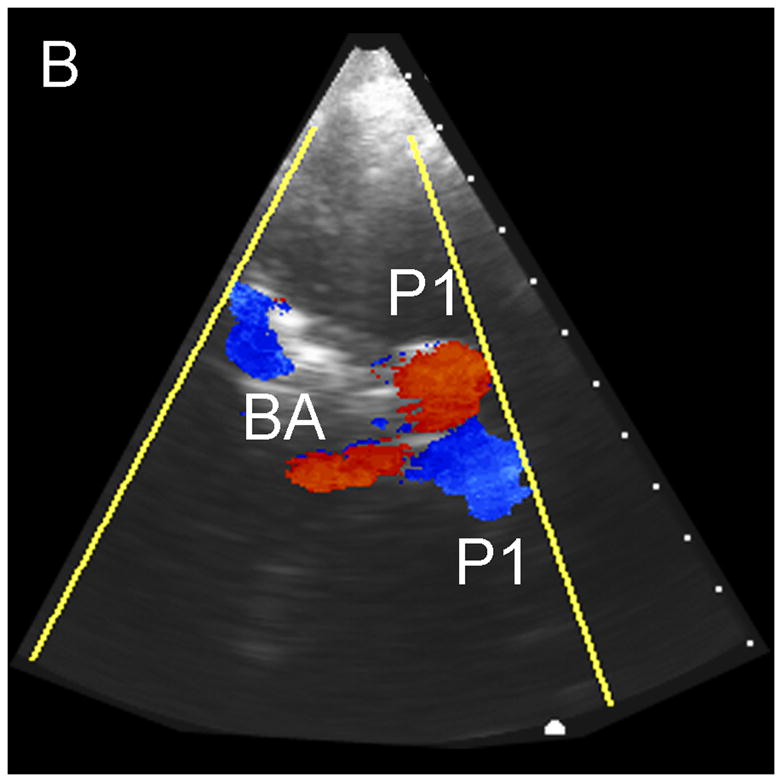
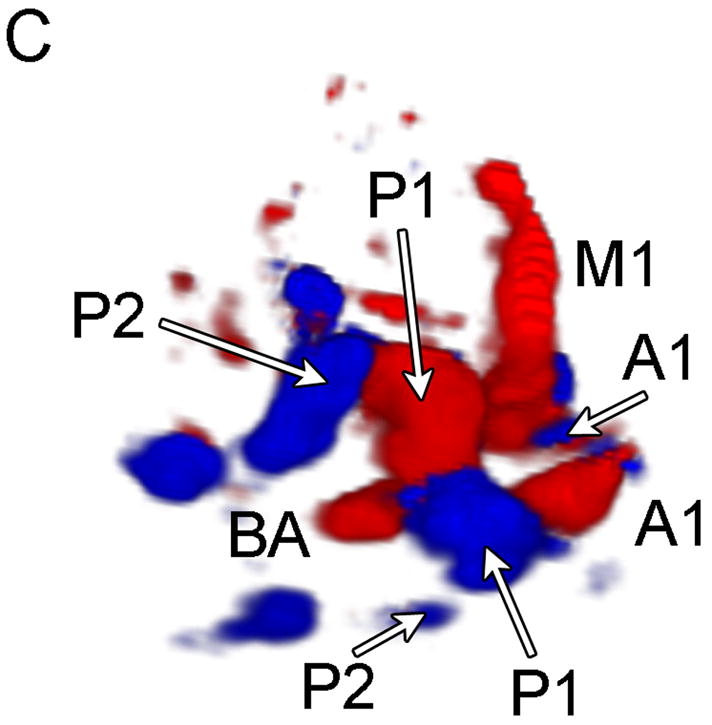
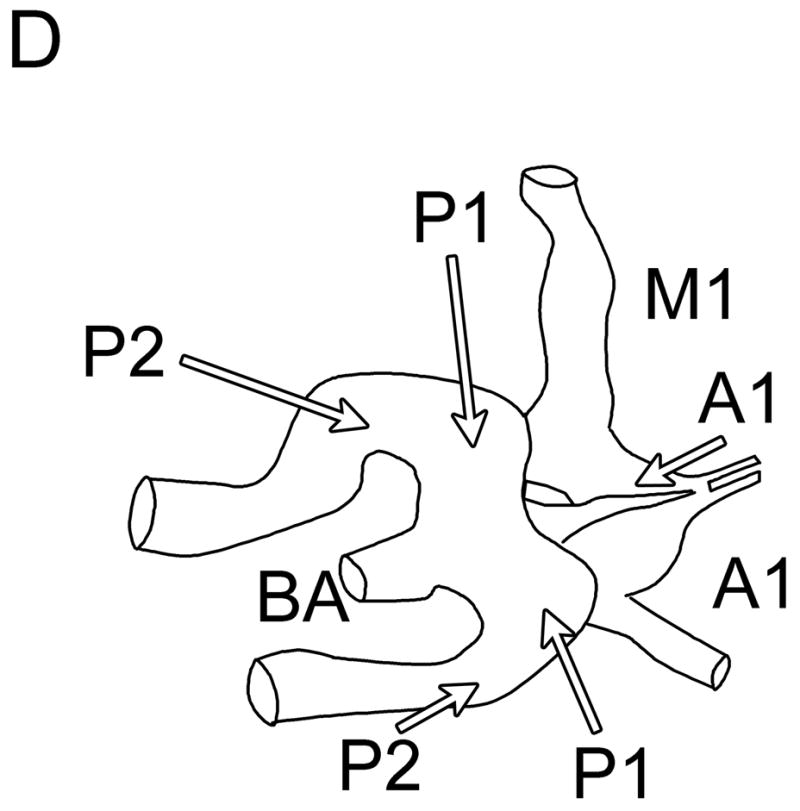
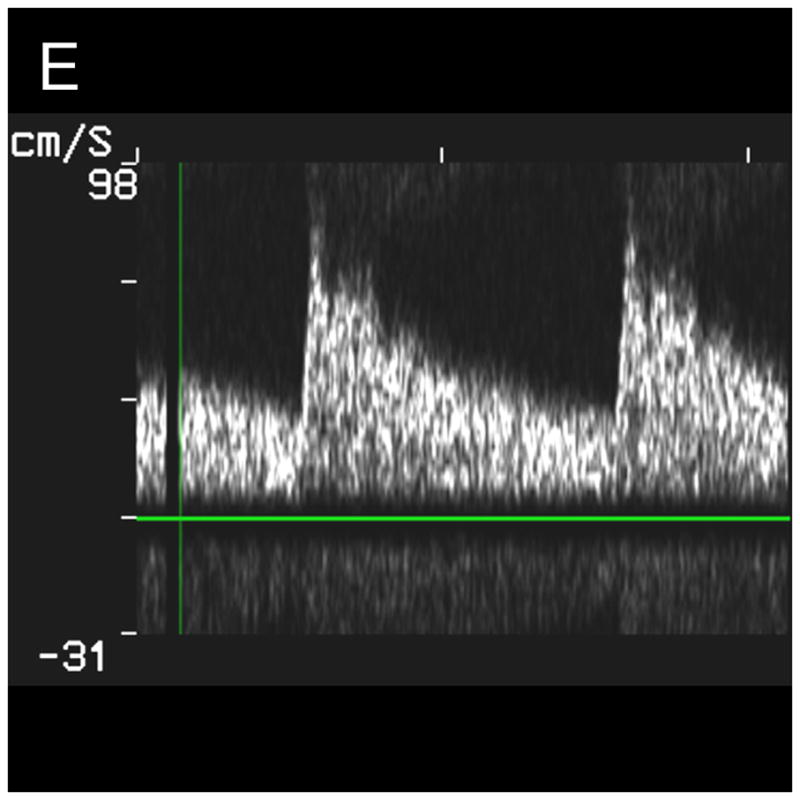
Typical Temporal Window Findings. (a) Axial scan showing the circle of Willis comprised of the ispilateral A1, M1, P1 and P2, as well as the contralateral A1, and P1. (b) Coronal scan showing the BA bifurcating to the P1 segments of the PCAs. (c) 3D color Doppler rendering of the cerebrovascular tree. (d) Schematic of (c). (e) Spectral Doppler trace from an M1 showing velocity over the full cardiac cycle.