
Figure 1.
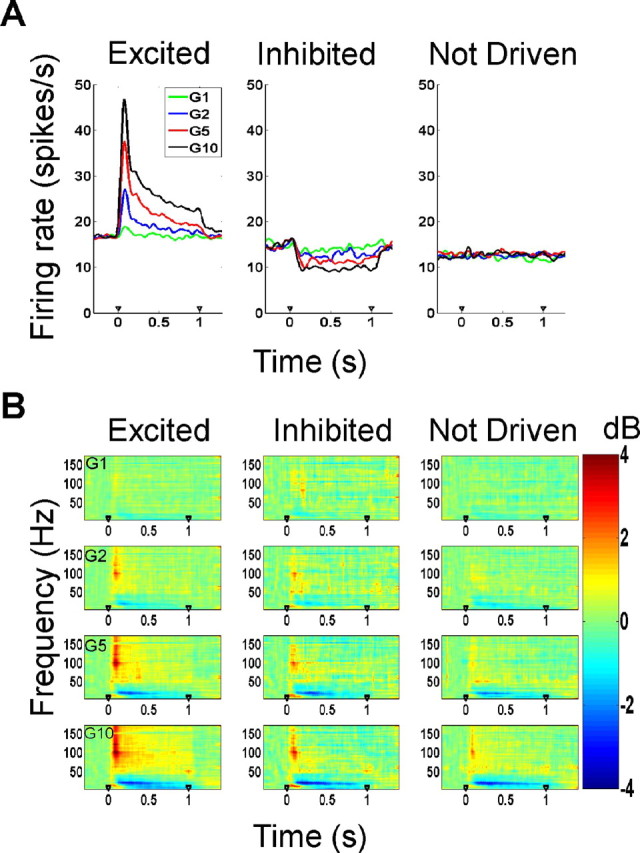
Firing rates and time–frequency analysis of the LFP. A, Mean firing rates of the three neuron types (excited, inhibited, and not-driven) as a function of stimulus amplitude. B, Time–frequency power differences (in decibels) from baseline (200–50 ms before stimulus onset) in the local field potential as a function of stimulus amplitude for the three neuron types.